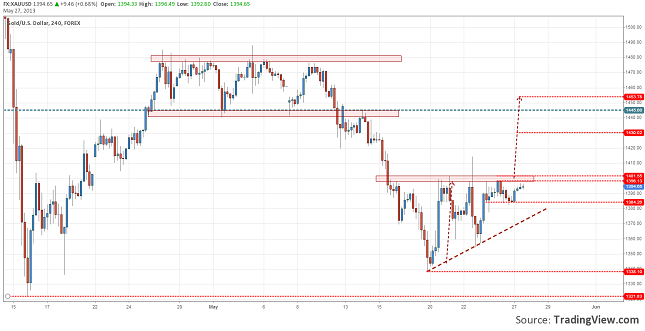
Have you looked at the chart of XAUUSD (Gold) lately? It looks pretty impressive. After the price broke down from the rectangle pattern, it fell back to 1338.10 dollar an ounce but it did not went through the 1321.00 low.
For the past week the buyers tried to bring the price of gold back to 1400$/ounce and they managed several times, but couldn’t close over this barrier. During Bernanke’s testimony it rallied almost to 1415.00 but it was pulled back really fast and it kept on consolidating right under 1398.00 resistance.
Leaving aside the big shadow that broke 1401.50 we can say that the pattern drawn is an ascending triangle. If the buyers will once again break the resistance area and keep the price there for a daily or 4 hour chart close then we might expect for it to rally back to 1430.00 or even touch the triangle’s target around 1445$.
If they will fail, and the price will fall under the local support from 1384.00, then we might see a pullback to the lower line of the triangle. A close under this line would certainly be a bad signal and the price might continue the fall.
XAUUSD Has Made an Ascending Triangle by Razvan Mihai


