
In 2012 McDonalds Corp. (NYSE: MCD) share price has moved more or less in a range, closing the year though, with a small loss. It was not that big of a deal because in January 2013 a new rally started, which has stopped only after a 17% gain.
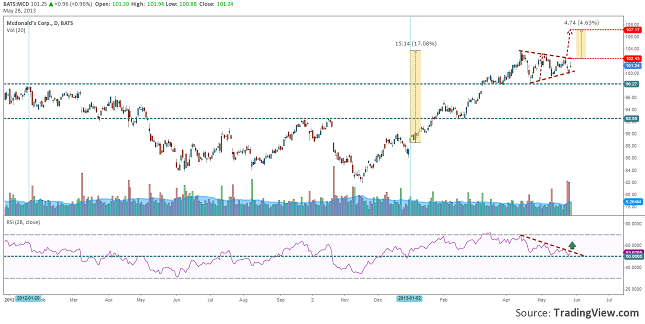
Chart: MCD, Daily
This up move has broken the September – October 2012 highs really fast and after a short retest it went after the 2012 high, which was broken in March. After touching 103.70 the uptrend was interrupted by a sideways consolidation, which took the shape of a symmetrical triangle.
Keeping in mind that the triangle is actually a continuation pattern in most of the cases, we are expecting an upside break. Why?…well because it has formed right above the 2012 high, which has earlier broken and above 100.00 round level the support area it is pretty strong and something really bad should happen for the investors to sell the company’s shares. Leaving aside the fact that the support area is pretty good, there are also other bullish technical indications like the 28 day RSI which seem to have stopped tight at the 50 level. A break through the resistance line of the oscillator could signal a new rally of the price.
We have all this signals, but it is not sufficient. We should wait for a price action confirmation, which would be a break and close on a daily chart over 102.43, the local resistance. If this will happen then we can expect another 5$ up move, or 4.6%, to 107.17.
Don’t forget that in trading nothing is 100% certain. Our second scenario would be a drop and close under the lower line of the triangle which would trigger a fall back to 94$ per share.
McDonalds Took a Break While Consolidating in a Triangle by Razvan Mihai