
The strategy that we will present to you in this article is a trend following strategy that can be used on any liquid market, especially on the Forex market. It can be applied on any currency pair and almost any time frame (recommended time frames from 1 minute to 4 hours).
The technical indicators that are used in this strategy are a combination of trend following indicators and an oscillator. The system uses the Parabolic SAR (0.01, 0.01, 0.4) and MACD (11, 22 and 9) for signals and confirmations and the 224 EMA for recognizing the trend. Using a slow EMA the trader will now which is the direction of the trend and will avoid entering on the corrective movements that could end up in closing the trade with a loss.
System’s conditions:
- Look for the trend. If the EMA is above the price, then the trend is down and the trader should try to find only short entries. If the EMA is under the price then the trend is up and the trader should look for buying points.
- Look for a sell/buy signal given by the MACD or Parabolic SAR.
- Look for a confirmation of buy/sell signal from MACD or Parabolic SAR.
What did we mean in points 2 and 3? It will be very rarely the situations when the Parabolic SAR and the MACD will give the same signal at the same time. So the trader should look for a signal given by the MACD and confirmed afterword by the PSAR, or a signal given by the PSAR and confirmed by the MACD.
Let us take the next example:
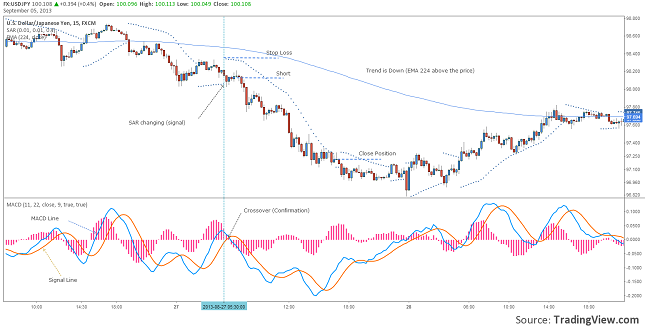
Chart: USDJPY, M15
The price fell under the 224 EMA, meaning that the trend is down. On 27 August, at 5:30, the PSAR signaled a sell (the indicator has drawn a point above the price). After 30 minutes the MACD signaled also a sell (the Signal Line crossed over the MACD line). The trader should have entered short on the next candle after the confirmation)
The Stop Loss can be set above the Parabolic SAR points. This indicator can also be used as a trailing stop for riding the trend as much as possible.
The exit points can be the reverse signal given by the PSAR, the crossover of the price with the EMA or even using the risk/reward ratio.
For the long entry a trader should look for the price to be above the EMA, for the MACD to signal a buy (the signal line to get under the MACD line) and the PSAR to signal also a buy (the PSAR points to get under the price)
Trend Following Strategy Using Parabolic SAR by Razvan Mihai