Forex Strategy & Forex Trading Strategies made by Professionals for Beginners & Experts

Wheat Price is Consolidating at a Key Support Level

Interval: Daily

wheat-consolidate-near-a-3-year-trend-line-14.05.2013

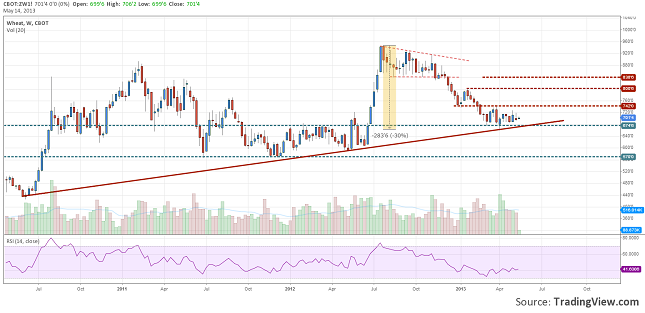
Looking at the evolution of Wheat price strictly from the technical point of view we will see that it hit a key level support. After its price touched a high at $9.44 per bushel it had dropped 30% back to $6.74 per bushel in 10 months.

In the same zone with the support level there is also a trend line which held the price above for almost 3 years. In this area the price has started a consolidation which could be either a continuation pattern or a reversal pattern.

All depends at this point on the weather. The price will be very sensitive at news regarding the weather but also at the forecasts of USDA regarding the crops and World Agricultural Supply and Demand Estimates (WASDE) reports.

So if it happens that the will fall under the trend line close under $6.75 per bushel, then it might not stop until it hits the next support at $5.70 per bushel. On the other hand if it will close above $7.4 level, then we can expect a recovery that will trigger more longs and get the price back up at $8 per bushel.

Central Banks Diversify Euro and American Dollar Reserves

On the long term, Central banks are considering the change of allocation in their investment portfolio, reducing the share of  US dollars and euros. If in 2000 the US dollar was the favorite, by the end of 2012 banks’ preference dropped considerably and US dollar’s share of total reserves declined from 62% to 54%. Moreover, Central banks consider that the best investment would be primarily in gold (as a deep and liquid market with no credit risk and with an optimal allocation of approximately 8% of the portfolio) and secondly in the alternative reserve assets (Australian dollar, Canadian dollar, Swiss franc, Danish kroner, Chinese renminbi ).

The most preferred investments are the renminbi, gold and Australian dollar. With China posing questions regarding its growing role in the global economy and its foreign exchange policies which maintain the currency controlled and allowed to fluctuate in a narrow range, gold remains the dominant asset for diversification.

For example, a study carrier out by Ipsos MORI (an important market research organization) revealed that Italian business leaders (91%) and citizens (85%) agree that the reserves of gold play an important role in the economic recovery of the country without selling it but using it as a warrant. In the same way, also UK investors see gold as a trusted source of security for their holdings.

Did you know?

“My Gold Plan” is a successful plan of buying gold. It was implemented in India, Japan and China so far. The aim of this project is to allow customers to save their money in an asset that won’t depreciate on the long term. This plan was launched by Reliance Money Precious Metals (a reliance Capital Company) and World Gold Council. Thus, based on a daily average pricing methodology, the Indians can accumulate different quantities of gold which may be withdrawn as 24 Karat gold coins or as jewelry. This scheme is not completely regulated but the World Gold Council assures people that is 100% backed by physical gold. This idea came up as a result of the increased demand for gold.

WTI Crude Oil Looking Bullish More than Ever

Interval: Monthly

wti-crude-oil-bullish-move-24.04.2013

Have you looked on the monthly chart of WTI Crude Oil lately? From our point of view it looks bullish more than ever.

We can see that from April 2011 a symmetrical triangle was drawn. The triangle is limited by a support and a resistance zone. The inside lines are drawn on the closing prices while the outside lines were drawn on the shadows. One thing to note is the lower support zone which is thicker because of the longer shadows.

The volume has dropped, confirming the volume pattern of the triangle. The RSI 14 has broken the upper line of its triangle and consolidated under 53.90. We can also consider the distance between the 50 EMA (dotted) and the 100 EMA as a support area.

Its price has fallen pretty fast in the first part of this month, in the support area, and touched a low at 85.61. From that point, the price was rejected and now the WTI is traded over 90 bucks per barrel. A little higher, at 97.45, sits the 4 month resistance. If the price will break through this level we will not be surprised if it will easily break the resistance area and rally to the next highs around $110 per barrel.

If this month will end like this or maybe with a lower body and an even longer downside shadow, then another signal would appear. We will come back with an update and, why not, even a trade setup.

WTI Crude Oil Continues Rallying While Brent Stagnates

In our last analysis, regarding the evolution of oil (WTI Crude Oil Leading And Brent Is Following), we have showed you that West Texas Intermediate Crude Oil was talking a considerable advance in front of Brent Oil. One of the most interesting arguments was seen on the chart of the premium evolution between the two types.

After half of month, we saw that the second scenario that we believed in has been confirmed. The price of WTI has rallied to the upper line of the triangle while the price of Brent Made a new low and remained under 110.0 dollars per barrel.

wti-crude-rallying-brent-stagnates-01.04.2013

Chart: Brent Crude vs. WTI Crude

It shouldn’t be a surprise for anyone that WTI managed to touch a high at 97.54. USA’s economy is signaling a recovery, meaning that the demand for oil is rising, and this can also be seen on the evolution of the stockpiles published on each Wednesday. If the macroeconomic readings will continue to stay on the positive side, we might see a continuation of this rally. If the price will break the line of the triangle there will be a high probability for the price to touch $100 per barrel.

wti-crude-stockpiles-01.04.2013

Chart: Stockpiles evolution of Crude for USA

While WTI demand rose, it seems that for Brent diminished. Europe’s economy is not looking that good. February was a very week month as it could be seen from the economic readings. There is a chance for the price of this type of oil to come back to $112 per barrel only if it will be able to close over 110 level. This week will be full with publications from European economy; good news might trigger a rally.

evolution-of-premium-brent-wti-01.04.2013

Chart: Premium Brent-WTI

Looking back to the premium evolution we will see that the lower line of the triangle had been broken, as expected, and now it sits at $13.

GOLD – Safe Heavens are Being Bought

Interval: Daily

gold-safe-heavens-are-bought-19.03.2013

A lot of bad news came from Cyprus today. At 16:00 GMT the deliberation started in the Parliament regarding the bank levy. The local reports suggest that none of the parties will vote in favor of this measure. The Finance Minister seems to have been forced to quit, but the resignation was not yet accepted.

For the moment the investors are looking for safe heavens. The dollar, the yen and the gold are being bought along with the 10 and 2 year German bonds and 10 year treasury notes from the US.

The market seems to have priced the bad news, but still could be dangerous for the risk assets, like Euro, to be bought. EURUSD is testing the 200 moving average and is getting pretty close to the 1.27  key support. EURJPY is getting closer to 119.75, under this level we can say that a Double Top pattern is to be confirmed and its target is at 113 yens per euro.

Even though the dollar is getting stronger, gold is not backing down. It has cracked 1600 and now it finds itself near to 1620 resistance. A close over this level would confirm the Double Bottom formation and we can look for a retest on 1680.

WTI Crude Oil Leading And Brent Is Following

Interval: Daily

wti-leads-brent-follows-15.03.2013

Looking back on the two types of oil chart, we will see that their correlation is very good, hitting a top at 0.9895 on the correlation indicator in the past year. For the moment is getting closer to an older low. This means that their moves are usually in the same direction, but usually one of them signals  the reversal first. Now the first to turn its direction was the WTI Crude and it seems that Brent is following.

Let’s make a technical analysis on each price action. For Brent oil we can see that he is in an uptrend, because it made higher highs and higher lows. As long as it will remain over 105.47 dollars per barrel there is a chance for prices to get back to the tops. On the other hand a drop under the level mentioned would be a bearish signal.

WTI Crude is in a symmetrical triangle because we can see lower highs and higher lows in the last evolution. Now it has rejected from the lower line of the triangle and seems to be heading for the upper one. It is pretty hard to forecast where the price will break the triangle because the demand and the supply are equilibrated, at least for the moment.

Getting back to the couple, we can mention other characteristics. If Brent will follow WTI, which now is trying to get to the upper line of the triangle, and pick up the pace, it might retest the broken trend line in the same time, but this would mean that the correlation index should turn upwards. This would be the first scenario, but there could be some more:

-  Brent to go down while WTI Crude to continue the rally to the upper line

- Brent to rally back to the trend line while Crude will return to the lower line of the triangle

- Or both will continue the down move and we might see the lows retested.

I think that the first two have a higher probability to come true than the last 2, if we look at the world economy evolution from this period. But never say never, so we should keep in mind the other two as well.

One other characteristic that I have found is an interesting evolution of the premium between the prices. The next chart is showing the evolution of the differences between the price of Brent Oil and the price of the WTI Crude Oil from August 2007 until now. The most interesting part is that in August 2010 it started trending up. After August 2011 it started consolidating in a symmetrical triangle. Now the pressure is on the lower line of the triangle. If it will be broken then we might see a WTI getting closer to the same price of the Brent, meaning that the correlation index could fall under the 0.7277 low. Another rejection from this line means that the consolidation will continue.

premium-brent-wti-crude

As a short conclusion we can say that using both charts for forecasting would improve the result of the analysis and for those who are interested in the medium to long term evolution of this two commodities to pay some attention to the price action at the lines (triangle’s lines or trend lines) and at the support levels especially for Brent.