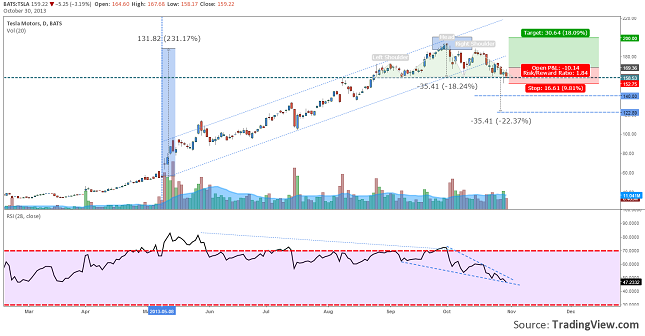
If you don’t remember our last analysis on Tesla Motors , here you have an update. The price of this stock got pretty close to the 200.00$ per share, but did not touch it. After a rejection the sellers managed to push the price back to a key support at 158.50 dollars per share.
Chart: TSLA, Daily
In the current state we can see a Hammer, candlestick pattern, which was formed on some higher volume, false breaking the support. If the price will break the 170$ level, we could see a rally back to the latest top or even to 200$ per share.
On the other hand we should not exclude the possibility of a longer correction move. If on a daily basis, the price will close under 158$ per share a Head and Shoulders pattern would be confirmed. The targets for this pattern are situated at 140.00$ per share and at 123.00$ per share. If the full target of the H&S will be hit, would mean a loss of 22.37% of the current price.
Our preferred scenario is still on the up side, taking into consideration the current trend. The trade setup includes a buying level at 170$, Stop at 153$ and a Take Profit at 200$ per share. Better signals could come after the companies earning report will be released. Until then keep an eye on the price action and the volume patterns.
Tesla Motors a Good Opportunity to Hunt for a Long by Razvan Mihai


