
Browsing my ‘to watch’ list for some interesting opportunities, I have found three stocks that you might also find interesting.
First stock is BIDU (Baidu Inc.). From the first days of July the price of this company started an uptrend and in less than three months it has gained 75%, raising 67$. From the beginning of August the price started to draw a Rising Wedge. Today the price rallied to a new high, above 154$, but dropped pretty fast back to 150$ per share. If the day will close around the current level we can say that the breakout above the upper line was a false one. Taking into consideration also the negative divergence from the 28 days RSI we could say that a drop might occur.
The confirmation will be a drop and a close under the lower line of the pattern. In this case the price target for the Wedge is situated at 116.78 dollars.
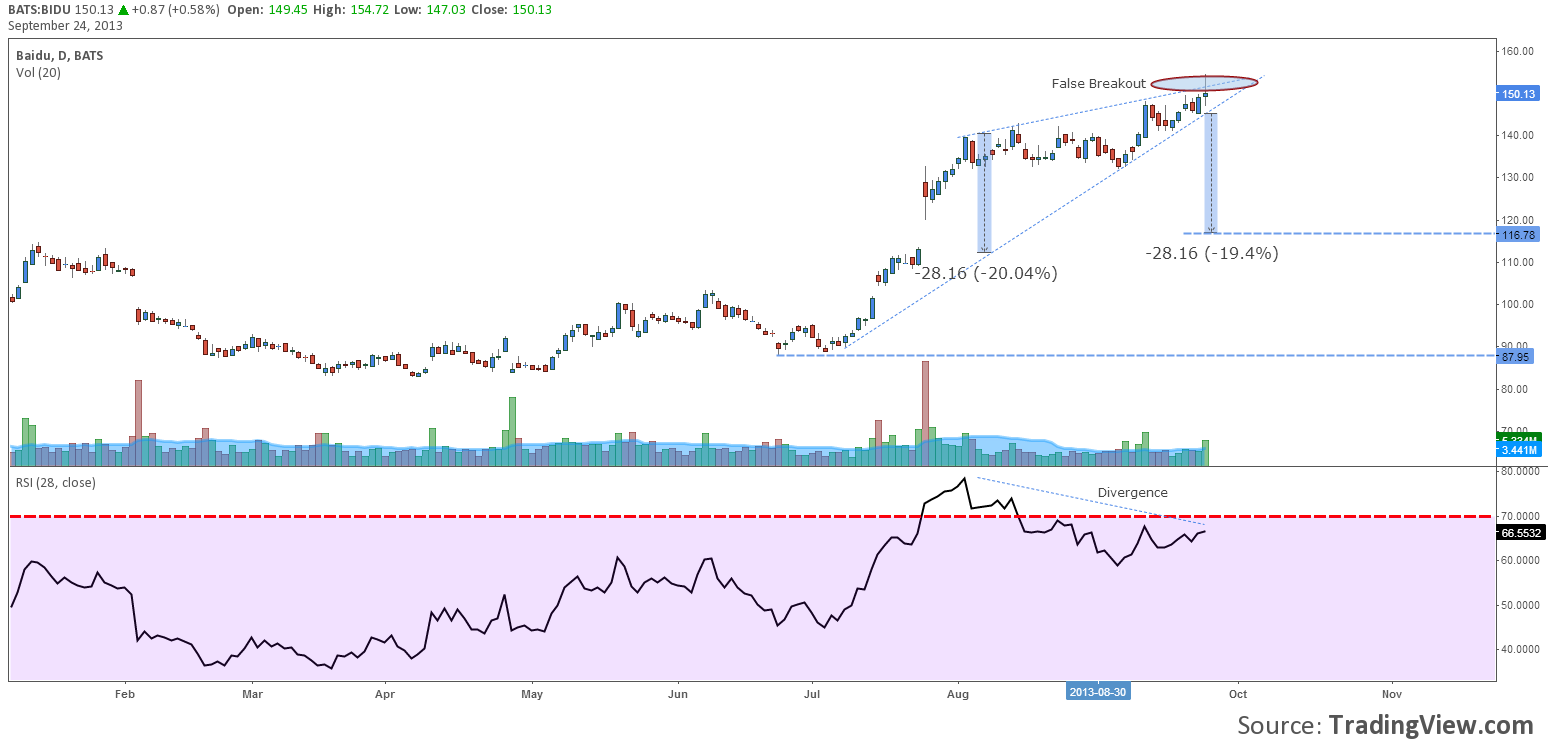
Chart: BIDU, Daily
Second in my list is Google Inc. which seems to be in a pretty stable up trend. After 845$ level was breached the price started to consolidate and seem to have drawn a reversal pattern. The Head and Shoulders is not yet complete. The base of the pattern is at 846$ per share, but the second shoulder is not yet finalized.
If the price of the shares will drop under 879$, the local support, then the probability for the shares to complete the H&S will rise. If the price will then fall under the pattern’s base line it might go all the way to 770$ per share.
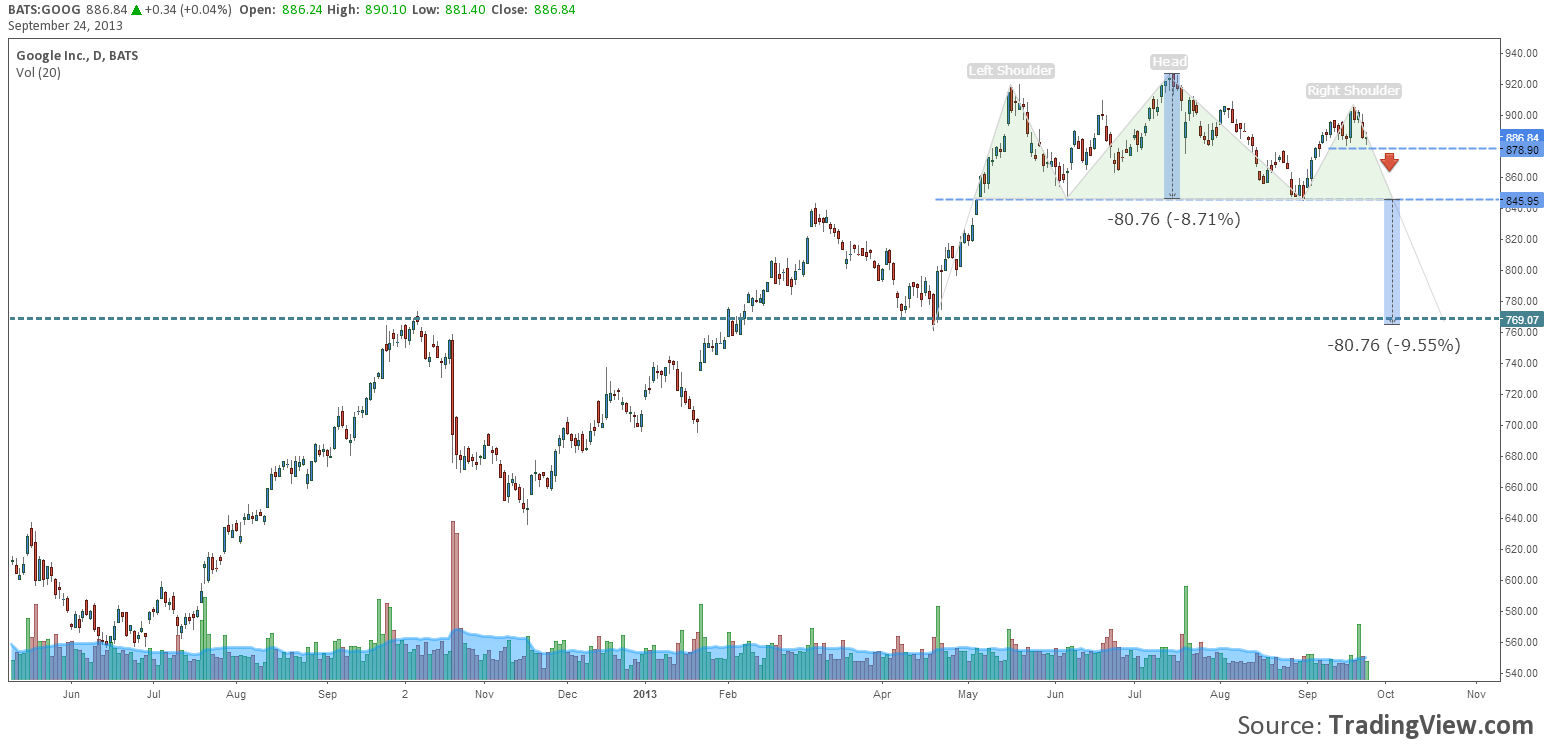
Chart: GOOG, Daily
My last, but not least, stock for you is J P Morgan. The chart of this stock it is beautiful from the technical point of view. After the price has broken the uptrend line, came back and retested it, forming this way the right shoulder for the Head and Shoulders pattern. The base line of this pattern is at a round level, 50$. A daily close under this support will confirm the pattern.
The first target for a drop would be the key support level at 46$ per share. The full target of the price pattern sits at 43$ per share, meaning a 14% drop.
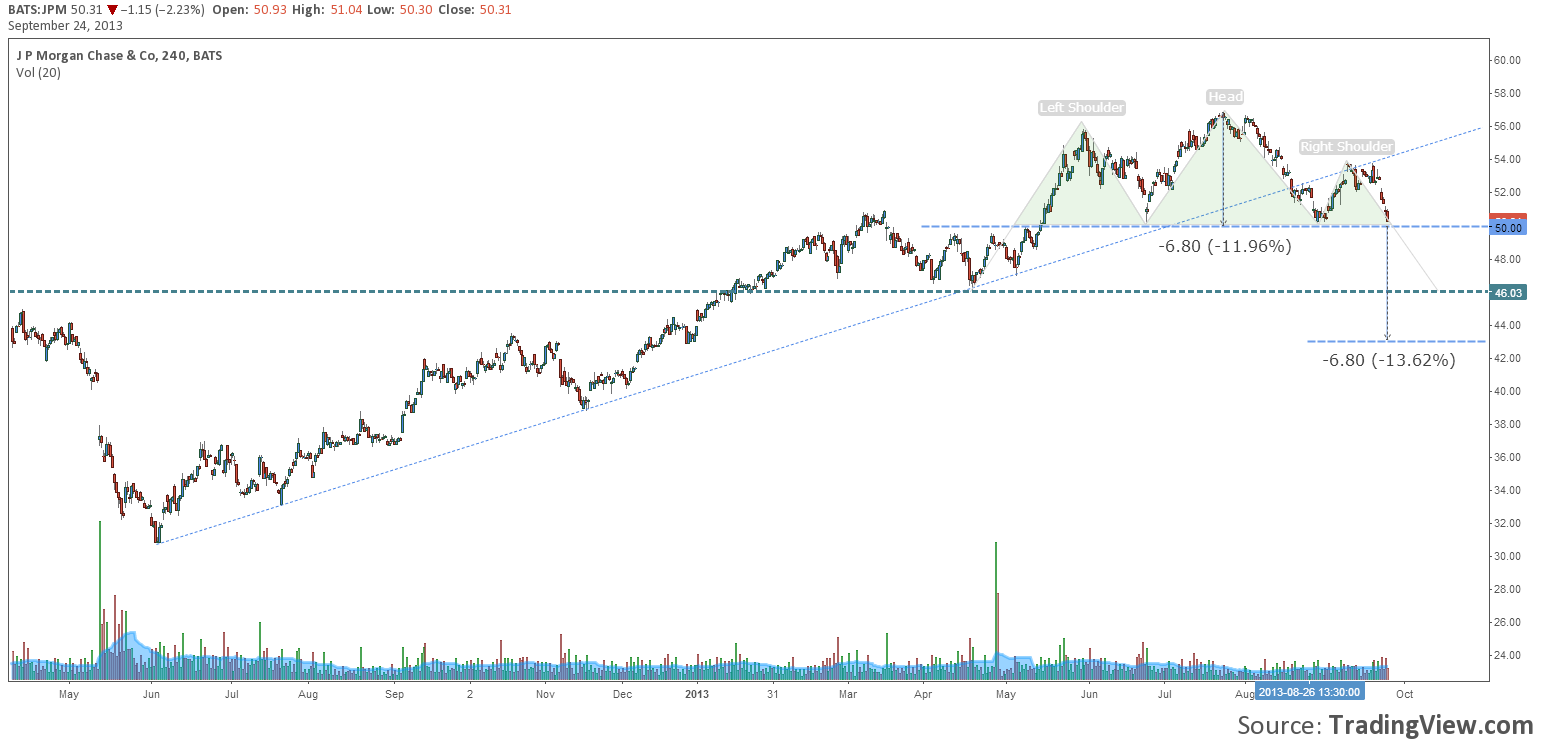
Chart: JPM, Daily
The charts look incredible and the current signals could be confirmed in the near future. But each trader should take the ideas and personalize them. Use their personal trading style, their own money management and position management to get as much profit out of these setups as they can.
Three Stocks you should Keep an Eye on for next Month by Razvan Mihai