
Chart: EURUSD, H4
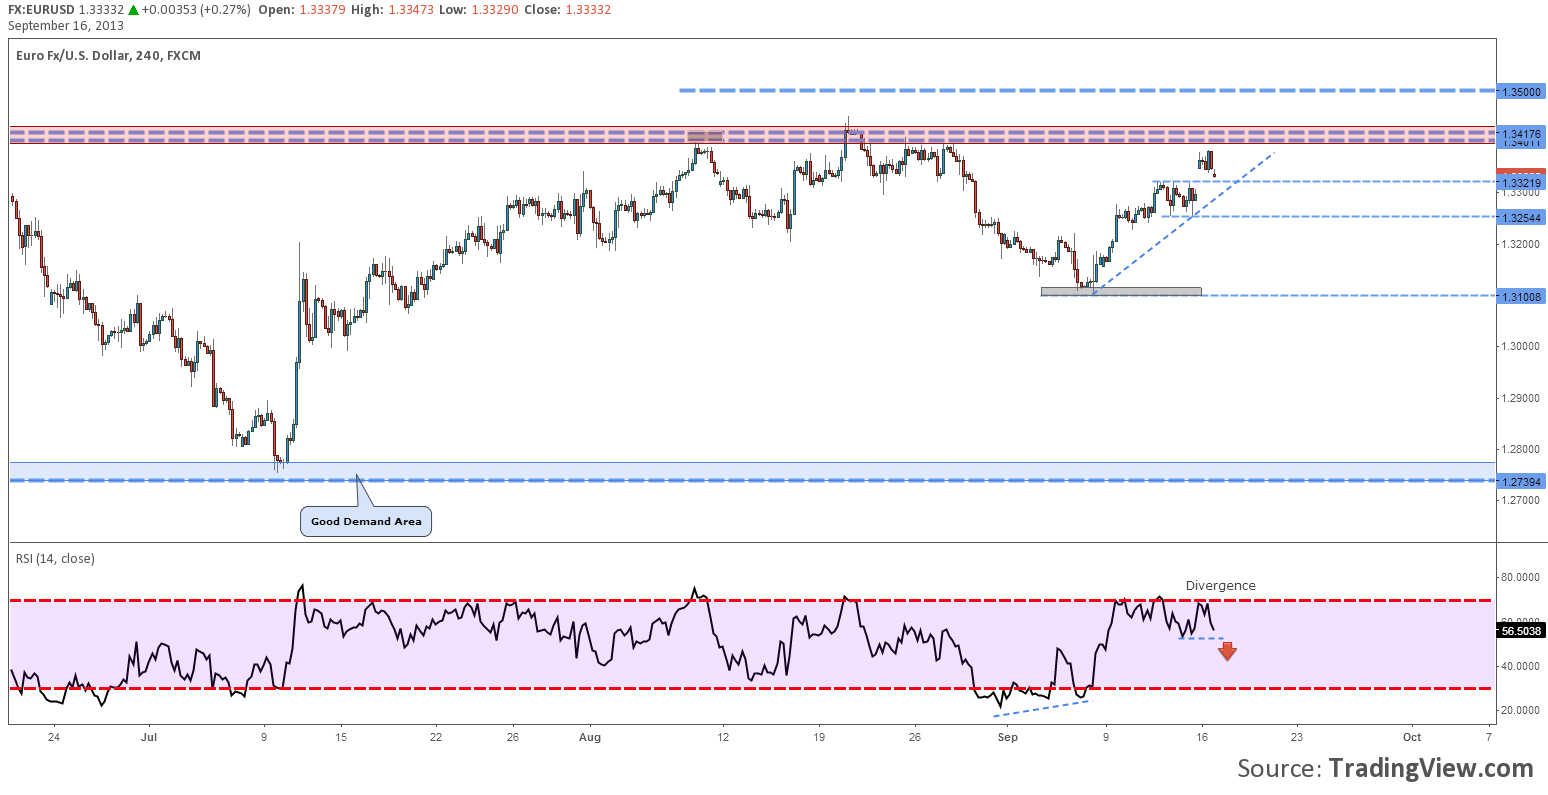
EURUSD doesn’t find itself in a very easy to read situation. On a larger time frame it can be seen that the price has moved sideways between 1.2740, the demand area, and 1.3420, the offer area. If the time frame will be lowered it can be seen that the price is pretty close to the resistance area.
On the four hour chart we can see an up move that was confirmed today by the positive gap. But the sellers have pushed the price back to a former resistance at 1.3321. If a 4 hour candle will close under this current support, we are expecting for the drop to continue to 1.3254, the next support. If the gap will not be fully closed and the price will rise above 1.3400 the price might rally above the latest high and touch 1.3500.
Even though the Technical Analysis proved to work and offer high probability signals for trading no one should omit the fundamental factors that move the market. At this point EURUSD’s price action is pretty sensible and could turn the statistics around.
This week’s main event is the FOMC meeting from Wednesday. Investors are waiting for news regarding the Quantitative Easing. Tapering or maintaining the program will trigger volatility and the markets might react different from what the technical analysis is signaling.
EURUSD Technical Overview for 16 – 19 September by Razvan Mihai