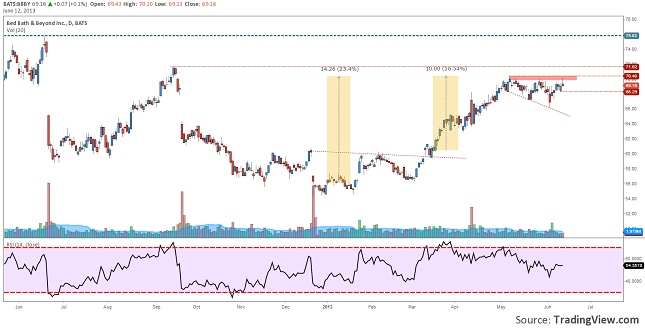
Do you remember this stock? On 13th of March I have published an analysis, NASDAQ: Bed Bath & Beyond Inverted Head and Shoulders, in which I have predicted an up move of the stock to 65$, 67.5% and eventually another top over 75.85$ per share.
Chart: BBBY, Daily
In three months the price has hit 2 of my targets, gaining 10 dollars (about 16.5%). Now it got to a cross roads point. The price hit a resistance at 70.40 and bounced back 2 times already. The pattern that has emerged looks like a Broadening Formation with a horizontal upper line. Usually this pattern is known as a reversal one, but in some situations it can also be of continuation.
What does the price action say? It seems like another bounce had taken place, and a Shooting Star, candlestick pattern, was drawn right at the resistance level. Confronting this with a pretty interesting divergence on the 14 days RSI we can expect a throwback to 68.30 or even lower at 66$ per share. A break through this low could mean that the price might start a bigger corrective move. I would recommend to those that are still on the trend to administrate pretty careful their trade and use partial close for profit taking.
I have just talked about one road. Now let’s get to the second one.
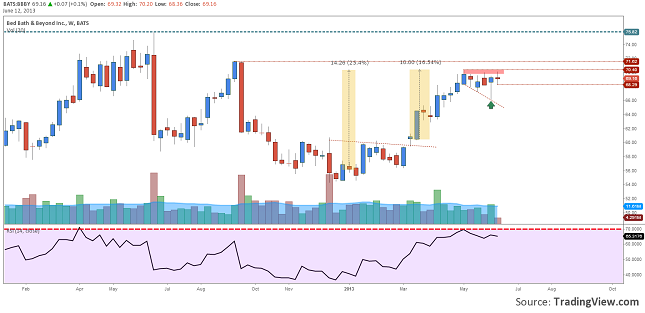
Chart: BBBY, Weekly
While on the daily chart, the situation is not in favor of the long side, the weekly chart is.
For the past 6 weeks the price has moved sideways. Last week’s candlestick looks pretty interesting. We can see a Hammer type candle in a range. Even if it is not a Hammer, this pattern signifies quite the same thing. The sellers tried to push the price under 67 bucks, but then the buyers intervened and pushed the price back up to 70$ per share.
Talking into consideration what I have written earlier and the fact the 14 weeks RSI is still in an uptrend and not yet above 70 level, we might say that it is a good probability for the current trend to continue.
If what to do is the question, then the answer is wait. A Stop Loss could be set under 66$. If the price will fall under this level you should consider cutting your losses. On the other side if the price will break 70.50$ then you might consider adding to your current position or enter a trade. The target for the up move remains the 75.50$ per share.
Bed Bath & Beyond Inc.(BBBY) has got to a Cross Roads by Razvan Mihai


