Have you missed our friend Bitcoin? We had some articles about this currency you might want to look over if you are interested in finding more about it: Bitcoin, a safe heaven or a speculative bubble? Part I and Bitcoin, a safe heaven or a speculative bubble? Part II.
As I was browsing the charts for something interested, I got to the Bitcoin chart and thought of trying the old fashion Technical Analysis on this new and almost Science Fiction currency. It isn’t anything to fancy but, if it will work then we will know what to use and how to use it in the future with this Bitcoin.
Chart: BTCUSD, Daily
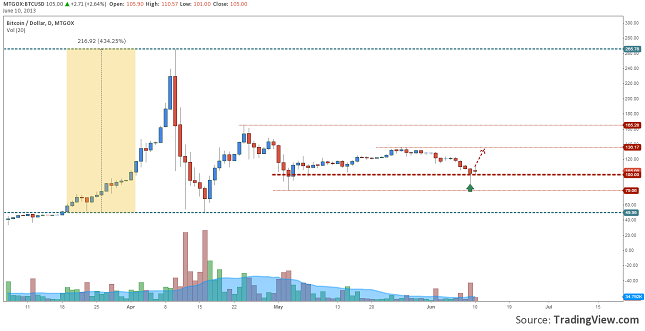
The currency pair started to rally right after the Cyprus bank problems, and it went all the way up to 265$/bitcoin from 50 bucks. This means a 435% gain in just several weeks. Of course it couldn’t stay there too much, it dropped back to 50$ and after that started to consolidate right above 100$/bitcoin. The last touch of this level was yesterday and we can see that a Hammer type candlestick pattern was formed and the volume spiked. In old fashion technical analysis this signal would be bullish and we should expect from now a rally to the upper side of the range, at 136$.
If the price will have a daily close under 100.00 support, then we might see it drop again back to 50$/bitcoin.
FX: BTCUSD Almighty Technical Analysis on Bitcoin by Razvan Mihai


