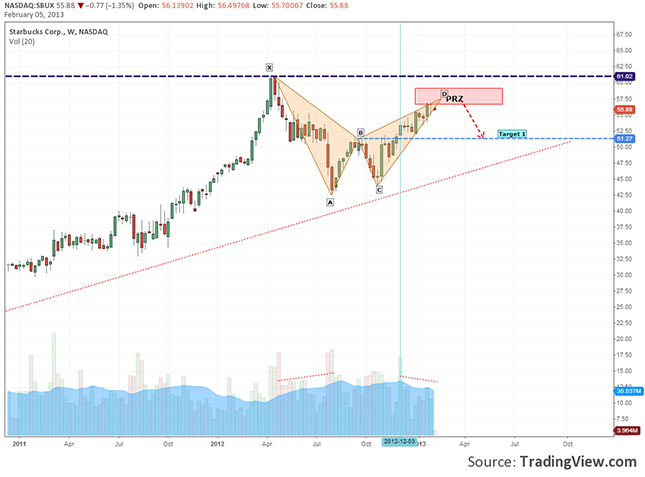
Interval: Daiiy The Starbucks stock displays on the chart a harmonic pattern in the form of a Bearish Bat. Coming from PRZ there is a chance a rejection could take place and go back to 51.27. On 20 timeframes the average volume is going down … [Continue reading]
FX: EURUSD Wave Theory After False Breakout
Interval:H4 After a false breakout over the Fibonacci cluster zone, the price fell like a rock to the target level where it met the trend line. A rejection might just be a false rally back to 1.3670-90 zone and after that the price might … [Continue reading]
NASDAQ: AMZN Last Week’s Price Drop Leads to Bearish Engulfing
Interval: Weekly After taking a pretty big series of hits last week, the biggest online retailer Amazon has formed a Bearish Engulfing in the immediate zone of the superior line of the channel. This could be a good signal for a correction … [Continue reading]
FX:EURJPY Falling Wedge of Weekly Chart
Interval: Weekly From the chart and a wider fundamental analysis i agree with the fact that the down trend looks to be over. As i said in a recent CHF/JPY post the need for depreciation is obvious but unfortunately the new economical politics … [Continue reading]
FX:EURUSD Elliot Waves with Fibo Extensions
Interval: H4 Using some basic principles from Elliott Wave Theory we can determine a possible reversal zone in the 1.3590 - 1.3645 area. Counting the waves from the 4th of January bottom until now we can observe that the price is on the 5th … [Continue reading]
FX:CHFJPY Forming Triangle at Trend Line
Interval: H4 Considering the state of economy in Japan, the Yen is still strong. Even if the economical politics will change in 2014 by implementing monetary easing, similar to what FED has imposed in the US. By looking at the chart we can … [Continue reading]