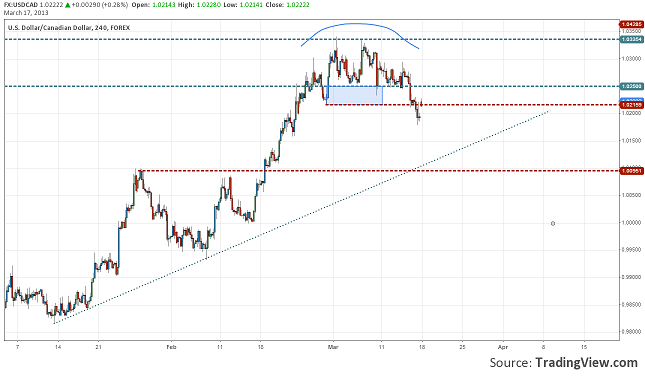
Canada Economic Indicator Actual Forecast Previous NHPI 0.1% 0.1% 0.2% Capacity Utilization Rate 80.7% 80.8% 81.1% Last week was quite poor in economic data releases from Canada. Both indicators came as expected. … [Continue reading]
Forex News and Analysis That Make the Difference

Canada Economic Indicator Actual Forecast Previous NHPI 0.1% 0.1% 0.2% Capacity Utilization Rate 80.7% 80.8% 81.1% Last week was quite poor in economic data releases from Canada. Both indicators came as expected. … [Continue reading]
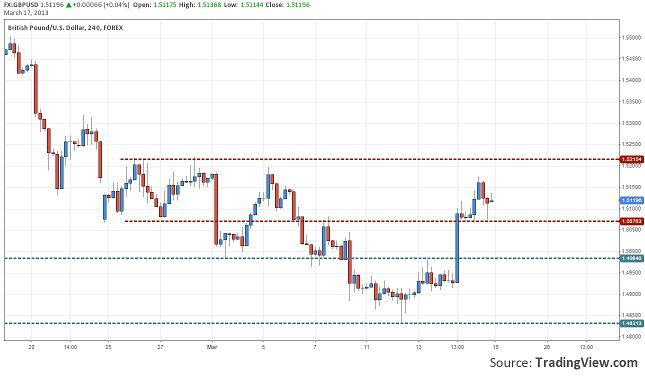
Great Britain Economic Indicator Actual Forecast Previous RICS House Price Balance -6% -1% -4% Manufacturing Production m/m -1.5% 0.0% 1.5 Trade Balance -8.2B -8.8B -8.7B Industrial … [Continue reading]
Europe Economic Indicator Actual Forecast Previous German Trade Balance 15.7B 17.9B 16.9B French Industrial Production -1.2% -0.1% 0.9% EU Industrial Production -0.4% -0.1% 0.9% EU Employment … [Continue reading]
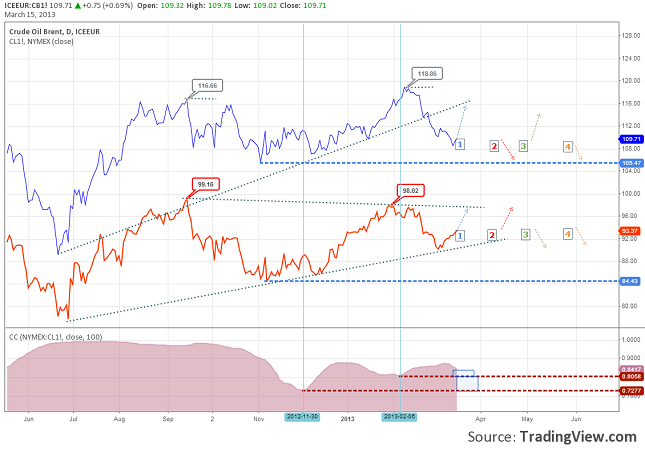
Interval: Daily Looking back on the two types of oil chart, we will see that their correlation is very good, hitting a top at 0.9895 on the correlation indicator in the past year. For the moment is getting closer to an older low. This means … [Continue reading]
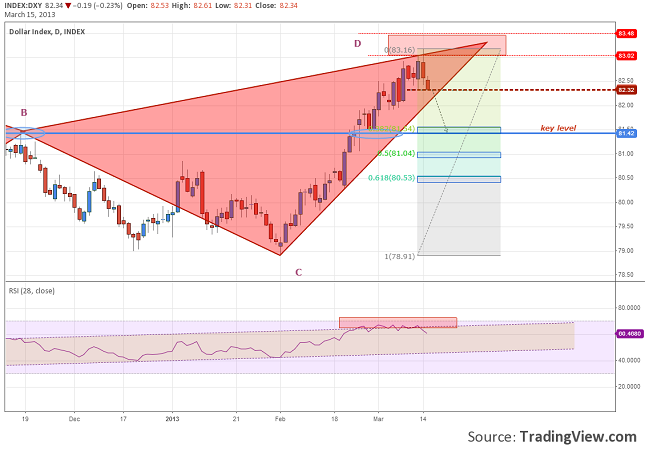
Interval: Daily This is an update of the last analysis on Dollar Index Even though the fundamentals are still favoring the dollar, we can see that the technical analysis is given more and more bearish signals. Price of the index got into the … [Continue reading]
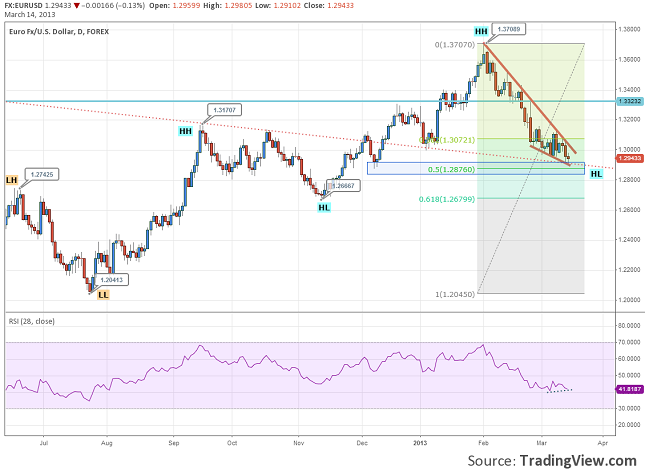
Interval: Daily On the daily chart it is obvious that the uptrend is still in place. The last low did not get to 1.2665 and higher highs were made. At this point things seem to get a bit confusing between the signals given by the technical … [Continue reading]
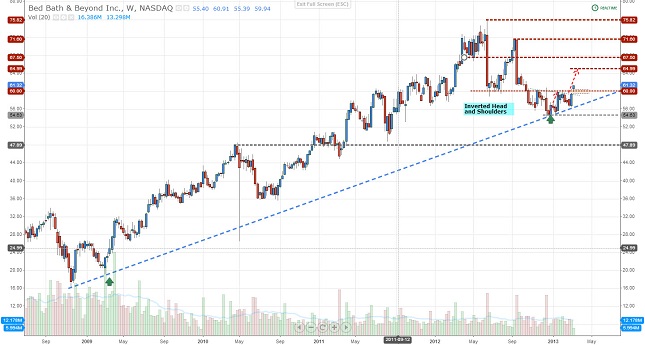
Interval: Weekly Bed Bath & Beyond Inc. (BBBY) is a chain of retail store and they are selling usually domestic merchandise. The chain includes 1,173 stores in 50 states, some of them are Puerto Rico and Canada. The company is … [Continue reading]
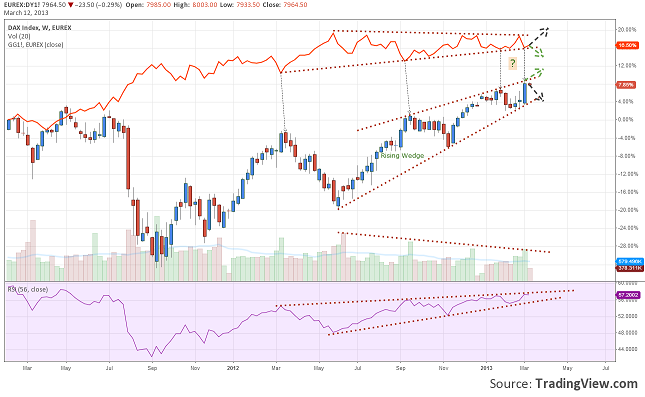
In mid-February the leading indicators (ZEW Economic Sentiment, Flash Manufacturing PMI and Ifo Business Climate) came in a positive direction, especially ZEW and IFO which have exceeded the expectations. In this situation we would have expected some … [Continue reading]
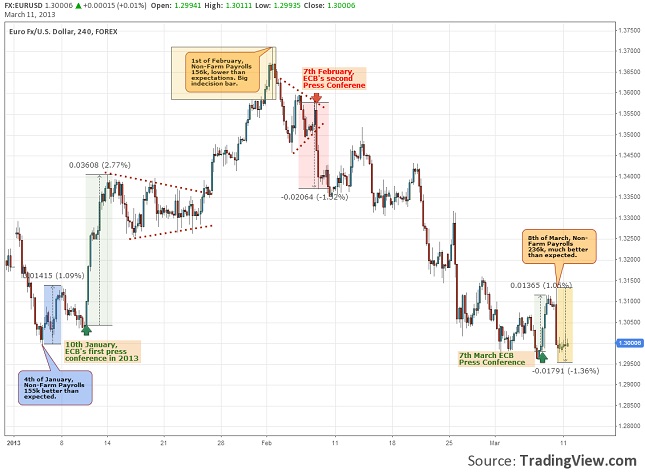
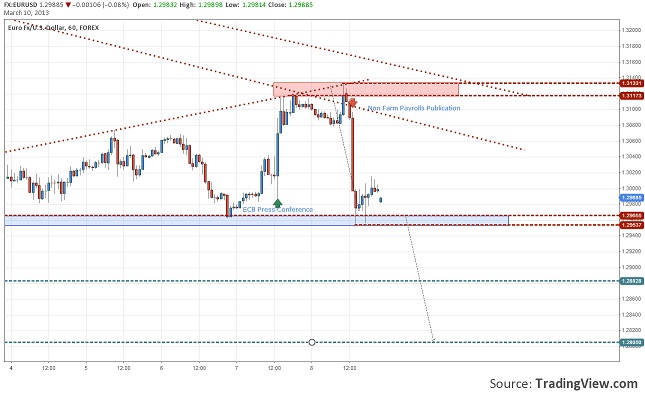
Interval: H4 It is well known that in this period Non-Farm Payrolls is one of the macroeconomic indicators that produces volatility in the market when is published, especially on EURUSD. Although it makes the market to move, it is not a very … [Continue reading]
USA ISM Non-Manufacturing PMI 56.0 better than 55.0 that was expected; ADP Non-Farm Employment Change came 198k; Factory Orders -2%, better than -2.2% forecast; Trade Balance -44.4B; Unemployment Claims 340k; Consumer Credit 16.2B … [Continue reading]
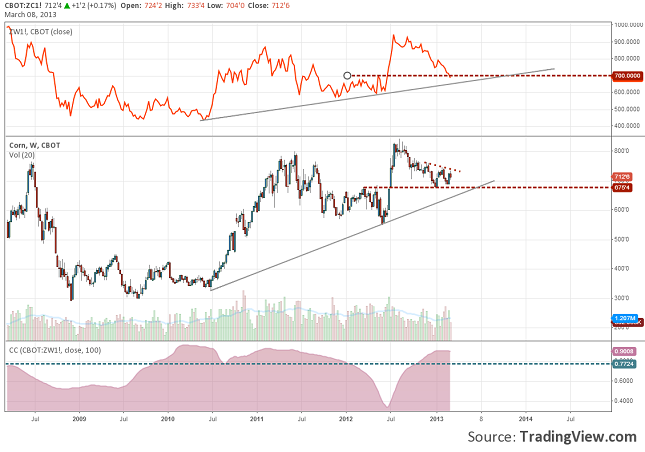
Interval: Daily Wheat is traded now at eight month lows, as we can see on the chart under the 7$/bushel support. This is mainly because the World crop forecast got to 690 m tons. In the USA the snow that fell over the wheat fields is helping … [Continue reading]
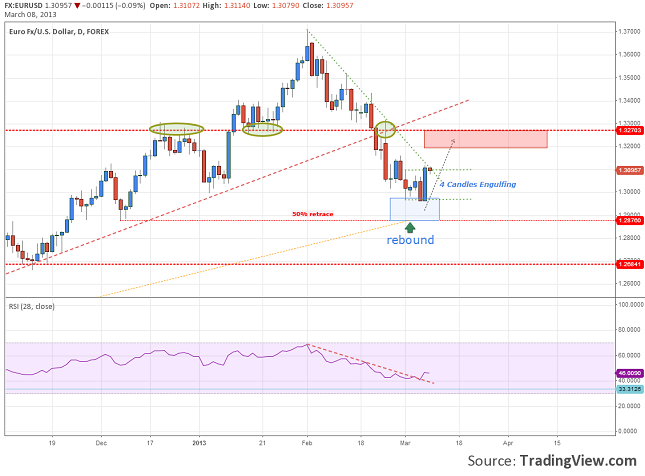
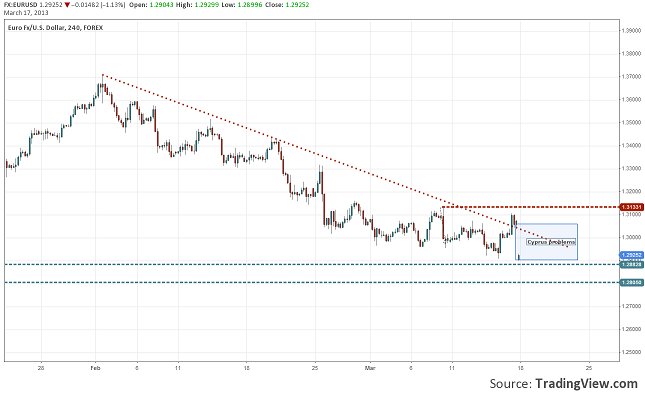
Interval: Daily The down trend was signaling exhaustion on the last impulses. It dropped under 1.3 level but couldn't go any further, possible reversal was signaled by the technical indicators (divergences on oscillators and important support … [Continue reading]
