In what concerns the candlestick chart we have established the basics in our previous article Candlesticks in Day to Day Trading. This type of chart offers information regarding the price action in a limited time frame like the opening price, the closing price but also the highs and lows. The body and shadows of a candle can be very important because their interpretation is different from case to case.
You may have seen in our past articles that we used different types of candlestick patterns to confirm our trading position. The patterns can be used in strategies and can help the trader reduce his false signals and have a better turnover at the end of the day or month.
It is important to know that a candlestick pattern can be formed from a single candle or more than one candle. There are usually two types of candlestick patterns: continuation (they usually need gaps and are pretty rare on the forex instruments) and reversal (which we will discuss later on). A candlestick pattern has more power and can be more reliable on a bigger time frame resembling very much with price patterns. On higher time frames they will appear less than on lower time frames, meaning that on lower time frames they could also give lots of false signals.
In my day to day trading I have more often used and benefit from the reversing type of candlestick pattern and I will go on with describing some of the most important patterns.
Bullish Patterns
It is relevant for a trader to look after bullish candlestick patterns at low levels, after the market had a down move.
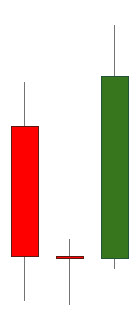
 Morning Star (formed of three candles.)
- It’s first candle should be a downside one, as longer as better suggesting that the bears are in control;
- The second one it is an indecision candle, meaning that it could be a Doji or a spinning top and it doesn’t matter the color. In the theoretical pattern the indecision should open with a gap down;
- The third candle should be a bullish candle and its body must exceed at least 50% of the bearish candle’s body. It should open with a gap up after the close of the Doji/Spinning Top.
The psychology of this candlestick pattern is pretty easy to understand. The first candle means that bears are in control, the indecision candle suggests that a balance is in place and the third one means that bulls are taking control and the price could rally under their pressure.
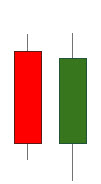
 Piercing Line (it is a two candles pattern)
- The first candle should be a bearish (red/black) one, the longer the better;
- The second candle should open with a gap down and its body should exceed at least 50% of the bearish candle.
This candle shows that at a low point the control of the price it is passed from the sellers to the buyers. In some conditions the signal given by this pattern could be very strong, still I believe that the next one is stronger.
 Bullish Engulfing (two candles pattern)
- The first candle should be a descending one and also the longer the better;
- Next candle should open with a gap down and its body should exceed the full body of the previous candle.
This pattern I believe it is stronger than the piercing line. When bulls take control from the bears, over price, their power is shown in the fact that the bullish candlestick engulfs the bearish candlestick. This is a pattern on which I have bet my money and didn’t disappoint me.
- This pattern is characterized by a small body (less than 10% of the full candle), a big lower shadow and a very small or inexistent upper shadow.
This is one of my favorite candlestick pattern, which I successfully used in different strategies and trade setups. It is very important for it to be found in a low and the lower shadow to be as big as possible. It shows that the bears tried to push the price very low. When bulls thought the price is very good, they start buying and pushed it back very close to the opening price. The color of this pattern doesn’t quite matter.
Bearish Patterns
Thea bearish type patterns signals sell opportunities. The patterns appear on tops after a rally and you will see that they the upside down images of the now-known bullish patterns.
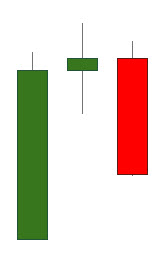
 Evening Star (three candles pattern)
- It’s firs candle is a rising candle confirming the up move;
- The second candle should open with a gap up and draw itself as an indecision candlestick (Doji or Spinning Top);
- The third and last candle of the pattern should be a descending one that covers at least 50% of the bullish candle. This one should open with gap up.
This is the mirror image of the Morning Star. Bulls are in control firs but the balance is equilibrated and this can be seen through the Doji/Spinning Top and after that the bears take control and the prices fall.
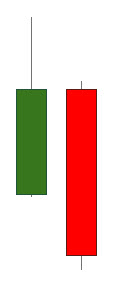
 Dark Cloud Cover (two candles pattern)
- First candle should be bullish (green/white);
- Second candle should open with gap down and its body should cover at least 50% of the first candle.
It might sound familiar the two characteristics, it is because this pattern is actually the mirror image of the Piercing Line but with a different name. Buyers are control, but the wheel turns and at a certain price sellers take their place in the leadership.
 Bearish Engulfing (two candles pattern)
- First candle should be a green/white suggesting a rising market;
- The second should open with gap up and its body should engulf the body of the previous candle.
Being an engulfing, but upside down, the interpretation is quite the same. Bulls are in control but bears take over and the market has now a strong sell signal. As well as for the bullish patterns I trust more the bearish engulfing than the Dark Cloud Cover.
 Shooting Star (one candle pattern)
- This pattern is also characterized by a small body (<10% of the full candle), but this time a long upper shadow.
It is very important to be found after a rally. Bulls are trying to continue the trend but get to a price where bears are starting to act and put pressure on the price so it drops. As well as in the case of the Hammer, this pattern is my favorite from the bearish candlestick patterns.
More on candlesticks…
As you could see I have brought up, where it was the case, gaps. The candlestick patterns were discovered on a volatile and with less liquidity stock market. The gaps there were relevant, but if we put this patterns on a high liquidity market like the FX market we might have the surprise to not find these kind of reactions. It doesn’t mean that the patterns won’t work, they actually will have almost the same impact as for the stock market.
These are to be considered the most powerful and used candlestick patterns there are. Don’t think that technical analysis is limited only at these 8 patterns. You will find that there are also Hanging Man, Harami, Dragonfly and Tombstone Doji, Reverse Hammer and hundreds others.
I can say that candlestick patterns can be some strong weapons for a trader in the battle with the market. But if they are taken as they are it might happen that their actual probability to not be that high. In my next articles I will show some of my way in using Candlestick Patterns in day to day trading and help you make some interesting trading setups.
A line that I am always keeping in mind and I would like to share it with you is:
Candlestick patterns revers moves not trends!
If you will keep it in mind you will not fall in the trap to lose control over reality. A candlestick pattern will never signal with a high probability a trend reversal.
Candlestick Patterns In Technical Analysis by Razvan Mihai


