
If you were curious how NIKKEI225, the Japanese stock index, looks like on a monthly chart, you would have been amazed. From my point of view its chart is like a technical analysis work of art.
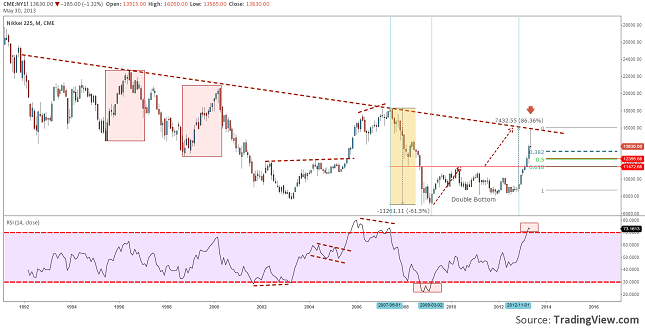
Chart: NIKKEI225, Monthly
For the past 21 years the down trend has respected the same trend line. The 14 months RSI has given good divergences and overbought/oversold signals. During 1995 and 2000 we can see 2 equal corrective moves and a 4 year Inverted Head and Shoulders between august 2001 and august 2005.
This was in the past, what now? Well… we can see that after the 61.5% dropped suffered between 2007 and 2009, the price started to consolidate. Actually it has drawn a reversal pattern named Double Bottom. This price patter was confirmed in February this year and 3 months later the price target was hit at about 16000, the same level where we can also find the down trend line.
Impressive, isn’t it? And that it isn’t all. We are now witnessing the formation of a candle stick pattern known as Shooting Star, which is a reversal signal. We will find out for sure tomorrow if this pattern will be confirmed at the closing of the market. If you need another bearish signal, take a look at the RSI, it went over the 70 level, which means overbought.
If we established the premises now we have to solve the problem. Looking at the signals and waiting for the right confirmation we can expect for the price to retreat back to 61.8, which is the same level with the Double Bottom’s base line. This would our favorite scenario, but don’t forget that nothing is 100% sure, so being aware of the fact that a new rise in the price might break the current high could be a smart thing to do. This is another story and we will get back on this subject as soon as the market will tell us something new.
Does it Look Bearish or Does it Not? NIKKEI225 a Technical Analysis Work of Art by Razvan Mihai