
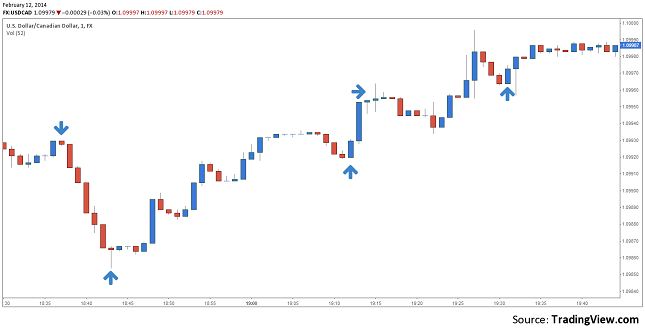
The candlestick chart is one of the most used charts in trading nowadays. It is thought to have been developed in the 18th century by a Japanese rice trader Munhisa Homma. He discovered that by drawing the price movements as a “candlestick” he will have more information that can be used in trading. In time analysts and statisticians have discovered patterns which indicates with a certain probability a continuation or a reversal in the price action of a certain instrument.
Let us see how a candle is formed and what its characteristics are:
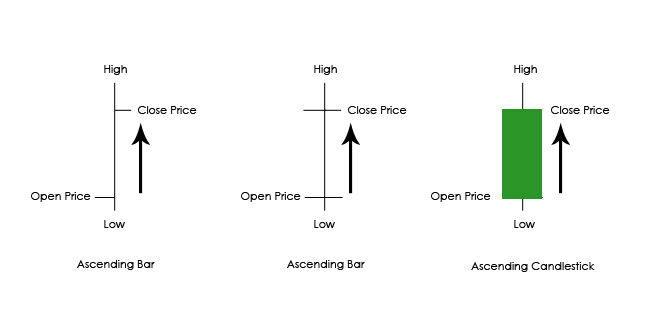
A bar shows the open price, for a specific time frame, the high and the low of the session and the closing price of that time interval. In the image you can see that the open price is on the left and close price on the right. Because the close price is higher than the open price we consider it to be an ascending candle.
If we are to draw a right horizontal line at the open price and a left horizontal line at the close price, like in the example above, afterwards fill the section with green we will have an ascending candlestick. This type of representation it is considered to offer more information about what happened in the trading session. A candlestick is formed of a body and upper/lower wick or shadow. The body is a specific element very important for traders.
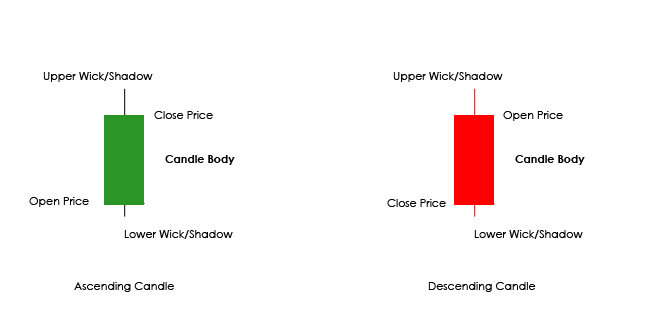
In the current examples I have used the custom colors for showing ascending and descending colors. Green usually represents a rise in the price, while red represents a fall and characterizes the bears. Don’t be limited to these colors. You will find that white (rise) and black (fall) are also used, or you can even customize them to fit your character and needs.
If the candle’s body has a specific shape it could tell the trader how powerful bulls or bears are. I will bring up several types of candles that usually show the market direction and determination.
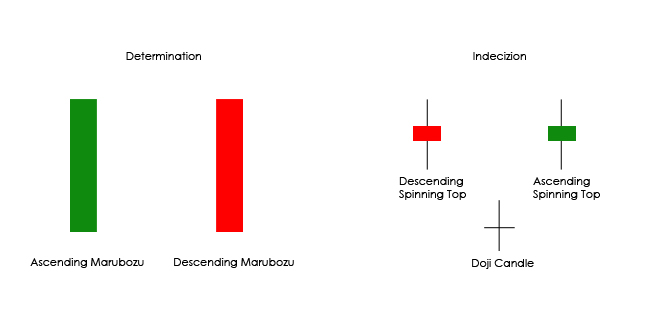
Marubozu – It is showing the direction of the market and which traders, bulls or bears are in control. It is formed only by a body with no shadow. It show that the market has strength in one of the directions. This interpretation can be applied also at candles with long bodies and very short wicks.
Spinning Tops – They show a balance between buyers and sellers and it is interpreted as indecision, a market pause. This candle is characterized by a small body and the upper and lower shadow almost equal. Indifferent the color they have it means the same thing.
Doji – It shows indecision and balance and it has the same interpretation as the Spinning Top but this one is characterized by the fact the opening price is as same as the closing price and the wicks are almost equal.
It is important to understand these basic elements about the candlesticks to be able to use them at their full potential. It is not enough to just take them as they are and hope for the best. In time strategies and patterns have emerged which rises the probability for a winning trade based on this type of chart. In our next article about candlestick we will talk about these patterns and discuss strategies that can be used in day to day trading on the Forex market or any other financial instrument.
Candlesticks In Day To Day Trading by Razvan Mihai