Forex Strategy & Forex Trading Strategies made by Professionals for Beginners & Experts

Is EURUSD Preparing For A Down Move?

Interval: Daily

eurusd-preparing-for-a-down-move-23.04.2013

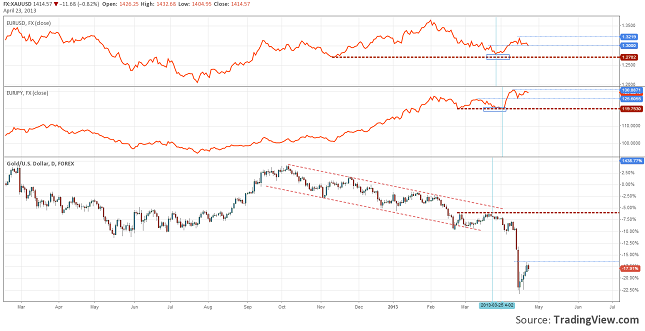
Remember this chart? We have used it in the past when gold was bought because of the risk aversion triggered by the Cyprus problems.

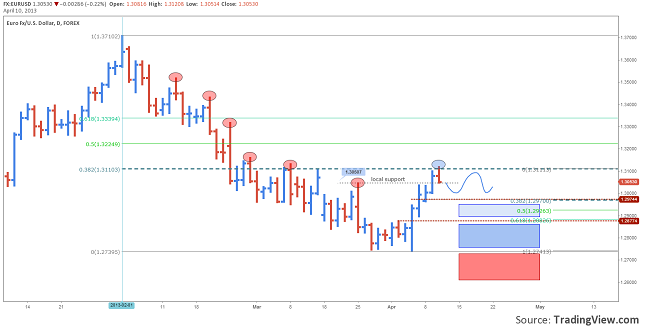
Well, the Double Bottom was not confirmed for gold, and the price fell, followed after several days by a rally for EURUSD and EURJPY. At this point we can see that the price of the precious metal recovered while EURUSD dropped back to 1.3 and EURJPY could not make another high. This might be the first signals for another plunge for the Euro.

If EURUSD will close under 1.3 and EURJPY will fall back to 125.50 than we can expect the safe heavens (Japanese yen, US dollar, Gold) to be bought.

Are you a medium term trader? Pay attention to more than just on signal, even though you are using only technical analysis or only fundamental. This way you will increase the probability to have a positive outcome.

AUDUSD is in a 10 Months Range

Interval: Daily

On 29th of June the price action of AUDUSD has made a new high but, was also the day that started the 10 month range. The first two throwbacks have determined the support zone between 1.01 and 1.0170, while the first high established an important resistance at 1.06. The resistance line is also a round number and became a psychological number.

The next down moves from September and October 2012 have established the main support at 1.0160. This level was broke in the first days of March 2013, but the price couldn’t close under it, and Hammer created announced another pullback to the resistance line.

At this point the price is heading back to the lower part of the range. Another rejection might keep the price inside these limits close to one year. But considering the situation of Australia’s economy we might see a lower aussie during the next months. They need a weak currency to help their exports. Looking at the pas economic indicators we will see that they were quite low, this might bring, inevitably, a cut in the interest rate. This might be the trigger for another break under the support, but this time confirmed.

EURUSD Has A First Reaction at 38.2 Fibonacci Retrace

Interval: Daily

eurusd-first-react-at-fibonacci-retrace-10.04.2013

The downtrend which started on first of February 2013 seems to have stopped at 1.2740 level on 4th of April. The first reversal signal is the higher high. Even though the price made a high at 1.3120 it seems that the up move wasn’t strong enough to break 38.2 Fibonacci retrace level and now EURUSD sits 2 pips above 1.3050.

For the reversal to be confirmed it will be necessarily for the price to make another higher low. It can find support at 1.2970, 38.2 Fibonacci retrace of the up move, and might just consolidate over this level. Or it could find another good support area between 1.2880, key support level (which is also 61.8 retrace), and 1.2970, mentioned earlier.

If the price will go under 1.2880 then the main downtrend might just have another chance to continue. A rejection from any of this levels or areas would bring in more buyers for the Euro and the price might rally back up to 1.31

FX: GBPUSD in an Accumulation Area

Interval: H4

gbpusd-formed-an-accumulation-area-21.03.2013

Last week economic data that was published for UK was weak, you can see the latest GBPUSD Weekly Wrap Up.

This week the CPI was, as expected 2.8%, with 0.8 percent over the inflation target of BOE, though. The Producer Price Index was published at an unexpected high level of 3.2%, with 1.5% over the forecast. This has pushed an alarmed button for the officials and they have said that from now on the inflation risk will be taken more seriously. Meaning that they might refrain from adding more monetary stimulus. Today the Retail Sales came 2.1%, way over the 0.5 percent estimates, and moved the pound higher.

News about the Bank’s asset purchase will be published only on 4th of April. Next week the economic calendar contains, between other indicators, the Current Account and Final GDB.

While looking at the down trend we discovered that the price has moved between four parallel lines. Two of them are forming a very nice descending channel. From the beginning of this month the pound has managed to keep itself around 1.5 level with the American dollar. It seems that an accumulation area was formed but not yet confirmed. The price didn’t break the inverted Head and Shoulders baseline, which is a very good supply zone.

The target of the reversal pattern is situated at 1.5574, the level is also a 50% retrace of the down trend. A four hours bar that will close over 1.5225 will be the price action confirmation that we are waiting for.

FX: EURUSD Something Smells Fishy - Technical Up Fundamental Down

Interval: Daily

eurusd-technical-up-fundamental-down-14.03.2013
On the daily chart it is obvious that the uptrend is still in place. The last low did not get to 1.2665 and higher highs were made.

At this point things seem to get a bit confusing between the signals given by the technical analysis and the ones given by the fundamentals. Looking to compare the economies, we can say that for the moment USA’s economy is stronger and advances fast, and Europe doesn’t look to good.

Yesterday we saw that the European industrial production has fallen at -0.4% from 0.9% last month, meaning that the recession danger grows for this quarter. On the other hand the data published for USA was very good. Retail sales grew  0.9% from last month, hitting 1.1% and the import prices got to 1.1%. Today the Unemployment  Claims fell unexpectedly by 10.000 at 332k and the Producer Price Index has hit the expectations at 0.7%, up 0.5% from last month.

This very good USA publications strengthen the dollar, and sustaining the downtrend. EURUSD has touched today a three months low at 1.2980. The current fundamentals are saying still down.

The technical view is a bit different. It signals a possible reversal. The price got near a very good support zone formed of the 50% retrace of the full uptrend,  the 1.2878 support level and the base line of an older Inverted Head and Shoulders. The RSI 28, has drawn a small divergence. Price action signals fatigue from the sellers. All this might trigger a reversal, but we still need a confirmation.

The question is “What now?”. We have different directions given by the two types of analysis. My answer would be “wait and see“.

It would be difficult to pick a direction right now so it would be wiser to wait for confirmations. New publications and releases for the fundamental analysis. And for the technical we can wait for a close over 1.31 for bullish confirmation, or a close under 1.2876 (50%)  for a trend continuation.

FX: EURUSD, ECB Press Conference vs. Non-Farm Payrolls

Interval: H4

eurusd-draghi-vs-nfp-11.03.2013

It is well known that in this period Non-Farm Payrolls is one of the macroeconomic indicators that produces volatility in the market when is published, especially on EURUSD. Although it makes the market to move, it is not a very easy indicator to trade. There are a lot of interpretations like risk appetite or aversion (due to the economic crisis), classic reaction, or how FED will see the data.

ECB’s press conference are also important events that are watched carefully by investors. Even from the period of Jean Claude Trichet, but now also, during Mario Draghi’s mandate, this events moved the euro in higher or lower grounds, continued or reversed trends. At this conferences the investors are looking for different signals, like optimism or pessimism in the speaker’s tone, promises, future possible changes in the monetary policy etc.

We looked over the market reactions, on the EURUSD, from the beginning of this year and observed some interesting changes in the price action for both ECB Press Conference and the NFP(Non-Farm Payrolls) publication.

In January first was the NFP published with a value of 155k, better than expected which ended with a strengthening of the Euro of 140 pips (1.09%). Six days later the ECB’s press conference, and Mr. Mario Drahi’s speech sent Euro even higher, rallying 360 pips (2.77) to 1.34. This have happened because his tone was very optimist and all the economic data were in the positive territory, he was also expecting even better data in the second half of 2013.

The trend has continued up an touched a high in the same day with the February NFP publishing. This time it was under the expectation, published at 157k. This triggered indecision, and we can see this in the price action. A quite big spinning top was actually the candle that touched the top. A pretty aggressive don move started and until the ECB press conference on 7th February the price consolidated  in a symmetrical triangle. This time Draghi was not the optimist anymore, the data signaled a break in the advance of the economy and he reaffirmed that he is expecting better signals, later this year, and not in the second half. The euro started to drop and fell 200 pips (1.52%). This was actually the beginning of a new downtrend.

The latest events were the ECB’s press conference on 7th of March, that was first. Draghi didn’t have anything new to say, just a slight more optimism than in February and that was enough for the investors to buy the single currency, pushing it 140 pips higher. It didn’t go too far because the Non-Farm Payrolls that came the second day erased the earlier gains. It was way over what analyst were expecting, published at 263k.

As a conclusion we can say that the dollar is getting stronger on the labor market data. If the NFP will continue to come better and better it is possible that FED will think about making changes in the Quantitative Easing program, especially if the unemployment rate will drop lower, closing to 7%. On the other hand the Euro Zone will get back the investor’s confidence and the trend will be changed only when good economic data will start to show on the radar.

Investazor will update the chart and will comment on new releases about this theme next month after the two events.