
USDJPY had a downfall last week after the Japanese economy showed some signs of strength. The household spending improved with a rate of 1.1% and the expected value was 0.5%. The most pleasant surprises were the industrial production and retail sales with both of them being published above expectations. Another important indicator that didn’t disappoint was Tokyo Core CPI that also came above expectations proving that “Abenomics” is making some progress.
Also, the political turmoil from Ukraine was a factor that led to the appreciation of the yen. In this kind of situations when uncertainty reigns, investors prefer safe haven assets and the Japanese yen is one of them. The US macro indicators were mixed but the markets are seeing only the good part right now as S&P 500 managed to hit a new record level.
Economic Calendar
Capital Spending q/y (6:50 GTM)-Sunday. The indicator measures the change in total value of new capital expenditures made by businesses and it is a leading indicator of economic health. It is forecasted an increase of 5.1%, so it will be interesting to see if the Nippon economy can maintain the level it showed last week.
Monetary Base (6:50 GTM)-Monday. It is the change in total quantity of domestic currency in circulation and current account deposit held at the BOJ. This is a low impact indicator. It is expected for the monetary base to rise with 54.2% this month.
[sociallocker]
10-y Bond Auction (10:45 GTM)-Monday. The average yield on the 10 year bonds that government sell at this auction continued to be on a run. This month it isn’t expected any big change.
Leading Indicators (12:00 GTM)-Friday. It is the level of a composite index on 11 economic indicators. Even though it was designed to predict the direction of the economy, it usually tends to have a low impact because most of the indicators used in the calculation are released previously.
Technical view
USDJPY, Daily
Support: 101.40, 100.75
Resistance: 102.80, 103.55
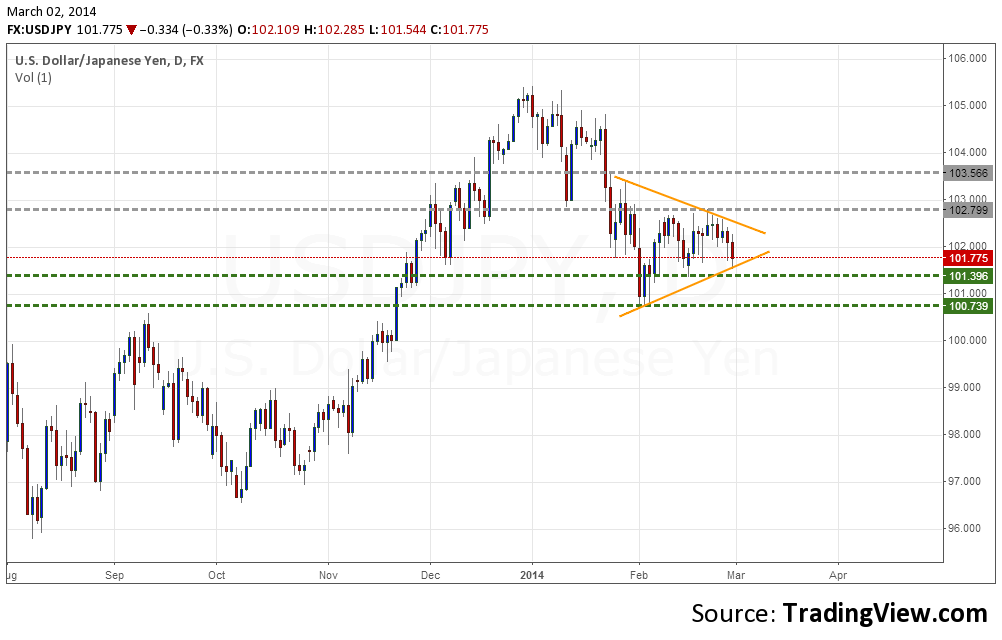
The daily chart seems a little bearish for USDJPY next week. A symmetrical triangle, which is a continuations pattern, looms on the horizon and could bring the price lower. A breakout confirmed by a daily close below the support line at 101.40 can be a catalyst for a continued downward movement and maybe even breaking under the 101 level.
USDJPY, H1
Support: 101.65, 101.40
Resistance: 102.30, 102.80
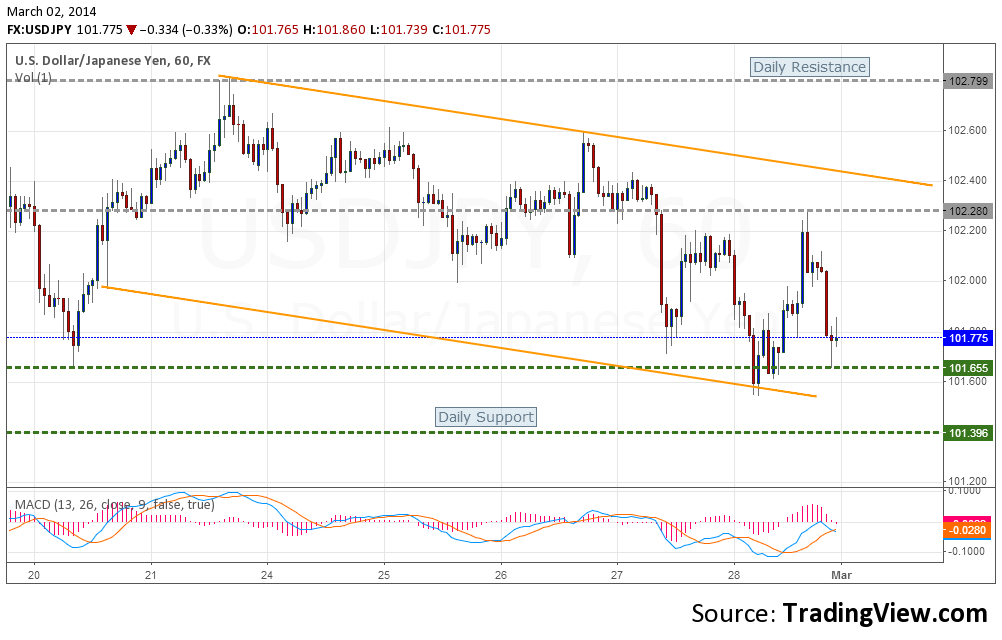
The hourly chart presents us a descending channel that is in line with the bearish view from the daily chart. The MACD Histogram shows how the price managed to recover on the final hours of Friday trading session, but the overall outlook still points toward a descending path. If the price goes below inferior line of the channel there will be high chances to see the price hitting the daily support line at 101.40.
Bullish or Bearish
Taking into account the technical part and the current international state of affairs I expect that USDJPY to slide to the psychological level from 101 as safe haven assets will be the winners of next week trading sessions. On the other hand, the bulls should not be underestimated as they could make a strong statement and send the USDJPY above the 102 level the way they did with the American capital markets in spite of the weaknesses the economy shows.
[/sociallocker]
USD/JPY Forecast March 3-7 by Alin Rauta