USDJPY capped a weekly advance amid speculation the Federal Reserve will keep cutting stimulus while BoJ maintains its record bond-purchase plan. Although Wednesday, the FOMC minutes signaled a possibility of a slowdown in the pace of stimulus cuts if the economy would show a prolonged period of bad macro publications, Friday appeared speculations that FED is unlikely to slow the pace of stimulus cuts.
Macro indicators played an important role in the appreciation of the US dollar in relation with the Japanese yen as all the indicators which were scheduled to be published for Japan came below the expectations. Flash Manufacturing PMI saved the week for the United States as it came above the expectations with a reading of 56.7 as opposed to 53.6, which was the forecasted value.
Economic Calendar
CSPI y/y (6:50 GTM)-Monday. The Corporate Services Price Index measures the price of services purchased by corporations and it is a leading indicator of consumer inflation because when the corporations pay more for a service, the higher costs are passed on to the consumer. It is expected to be published around 1.2% while last month had the value of 1.3%.
Household spending y/y (6:30 GTM)-Thursday. This indicator is a very important one as consumer spending represents the majority of overall economic activity and also indicates the state of the economy. It will be interesting to see how this indicator turns out as it is expected at 0.5%.
[sociallocker]
Preliminary Industrial Production m/m (6:50 GTM)-Thursday. This is the first version of the indicator and being the earliest, tends to have the most impact. It is also a leading indicator of economic health as it is correlated with consumer conditions. This month is expected to be at 3.1% and you should pay attention at it as for the last five months was published below expectations.
Retail Sales y/y (6:50 GTM)-Thursday. It measures the change in the total value of sales at the retail level and it is a very important indicator being a primary measure of consumer spending. This month it is expected an increase of 3.9%.
Housing Starts y/y (12:00 GTM)-Friday. A leading indicator of economic health due to the wide reaching ripple effect as jobs are created for the constructions workers, so an actual value above the expectations is good for the Japanese yen. For the last four months this indicator was reported above the forecasted value, so it will be interesting to see if the retail-estate sector is slowing down too in the Japanese economy.
Technical view
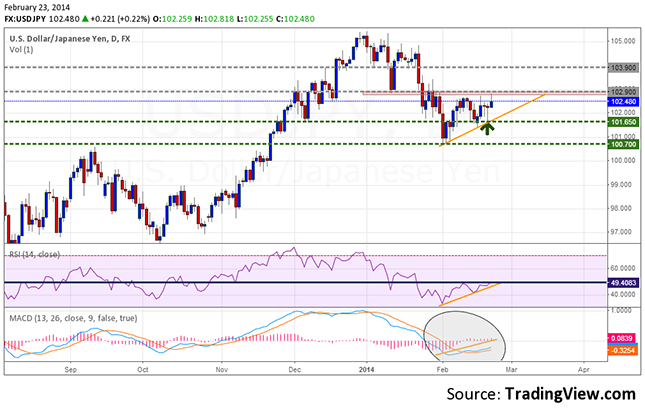
USDJPY, Daily
Support: 101.650, 100.700
Resistance: 102.900, 103.900
On a daily chart I see some bullish signs for the USDJPY in the week to come. There is an upward movement as you can observe the trend line and also two candlesticks with a large inferior shadow which scream “bullish”. The RSI on 14 periods looks a lot like the price action on the chart and the MACD Histogram shows us a more aggressive behavior from the buyers as their power seems to increase. In order my bullish hypothesis to be validated we need a breakout confirmed by a close above the key support at the 102.900 with a target at 103.900.
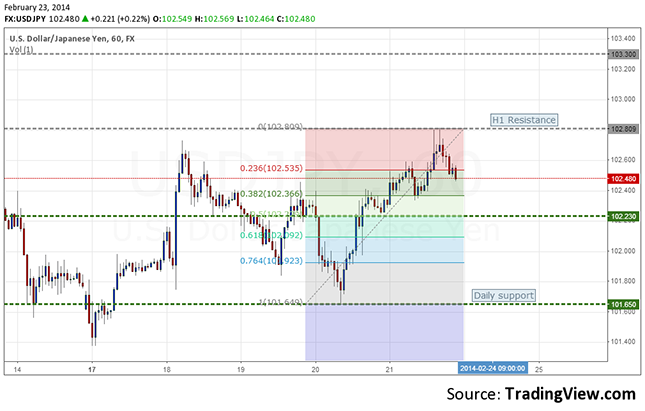
USDJPY, H1
Support: 102.230, 101.650
Resistance: 102.800, 103.300
On the H1 chart we can see a tentative of an ascending trend with a higher high which hit the 102.800 resistance and then retraced between 23.6 and 38.3 Fibonacci levels. On the short term I see the price testing the 50.0 level and even going under it before continuing the ascending trend and closing above the H1 resistance from 102.800 with a short term target at 103.300.
Bullish or Bearish
Overall, the daily and intraday charts make me to consider the momentum will remain with the US dollar next week as I see USDJPY at least surpassing the 103 psychological level. On the other hand, taking into account the macro indicators we will have next week for the Japanese economy, I still am cautious regarding a surprise on the downside for USDJPY.
[/sociallocker]
USD/JPY Forecast February 24 - 28 by Razvan Mihai


