
Did you miss a commodity analysis? We have watched the price of cotton for some time now to give us a bullish signal.
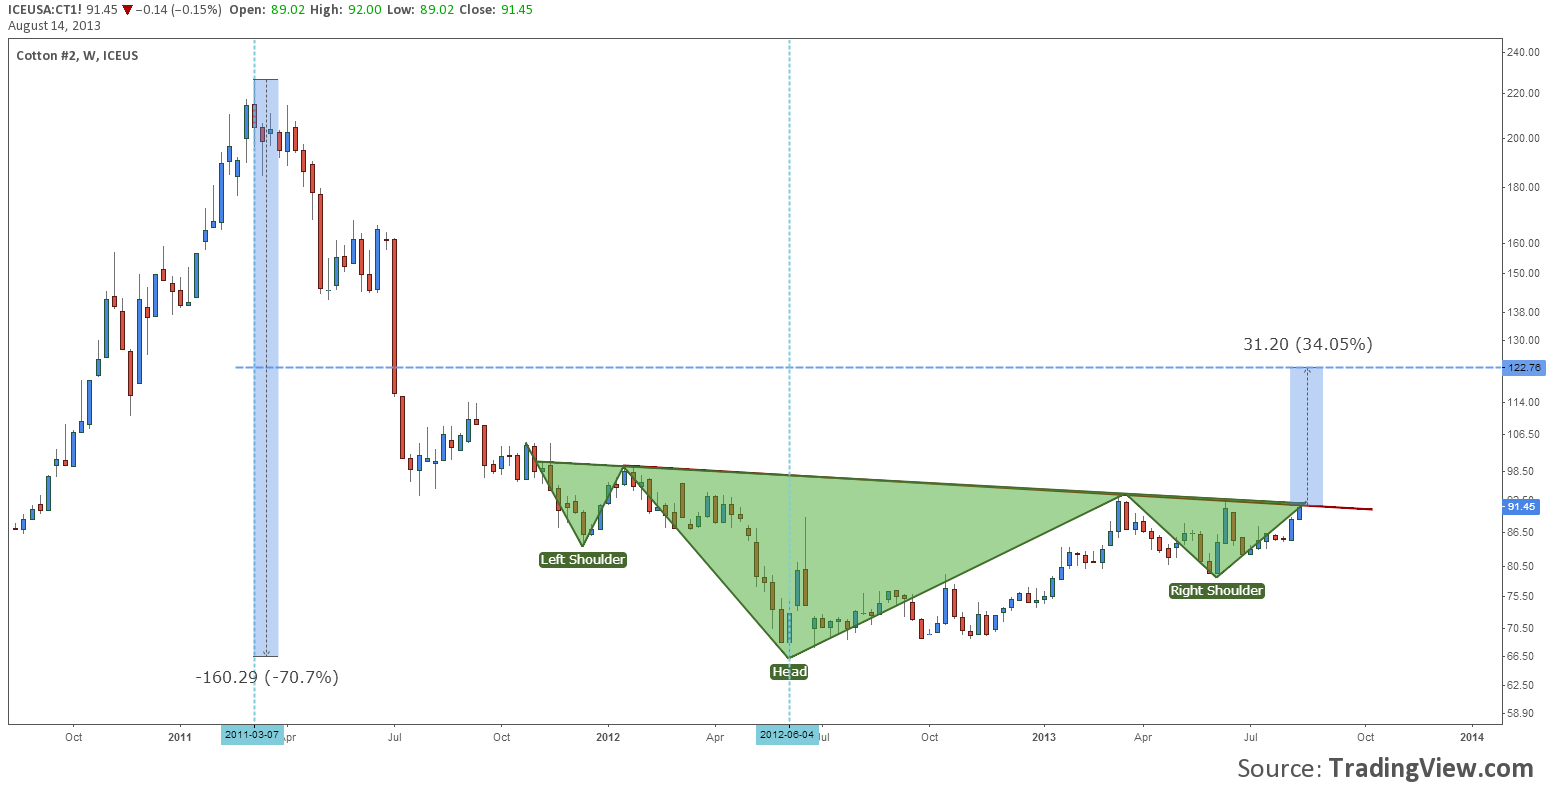
Chart: Cotton, Weekly
In March 2011 the price of cotton reached a historical high, at 227.00, after a low production and high worldwide demand. As usually the history repeated itself. Producers saw the potential in planting cotton and they started to plant record at record levels, resulting in a production that overwhelmed the demand.
In June 2012 the price got to a low of 66.10, dropping more than 70% from the all-time highs. But from 1st of January 2012 the price of cotton started to draw a Head and Shoulders Inverted, a pattern which could be actually build in an accumulation area. The base of the area is situated around 92.00.
At this point the demand for cotton seems to have increase. A big part of the worldwide production is held by China, so the prices might get to higher levels in the near future. If this week, or next 2 weeks will close above 92.00 we will have a confirmed a reversal price pattern. In this situation the target for the Inverted Head and Shoulders sits at 122.76, meaning a 34.00% rally from the current levels.
If anyone would like to profit from a possible rally of the price of cotton there are some possibilities. Investing in futures on the CME or on CFDs would be one of the solutions, while the second would be buying a LEAP call option with 95 – 100 strike.
Going Bullish on Cotton Looking For a 34% Rally by Razvan Mihai