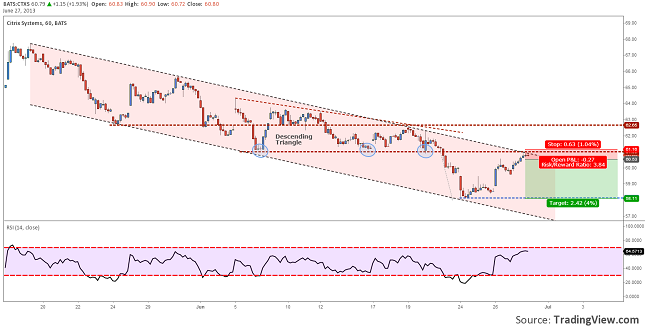
We are observing this stock for some time. From 17 May the price has respected a down trend channel. On the last corrective move was drawn a descending triangle. This pattern usually signals a continuation of the down trend. After the 61.00 support level was broke, the price fell right to the target of the triangle, which was near the rejection line.
Now we saw that, on a 60 minutes chart, the price made another correction for the down trend. It rallied from the 58.12 low all the way back to retest the 61.00$ level. In the same area it has also found the trend line. It would be pretty hard for the buyers to break this resistance zone.
Our favorite scenario would be a bounce from the trend line and the round level resistance. If this will happen then a fall might just bring the price back to 58.10 support. A second scenario would be a break and close above the resistance area. In this case the price target would be 62.65 and the Short setup will be considered deactivated.
Confirmation level: 60.53
Take Profit: 58.11
Stop Loss: 61.16
Trade Setup Citrix Systems (CTXS) Retested the Trend Line by Razvan Mihai


