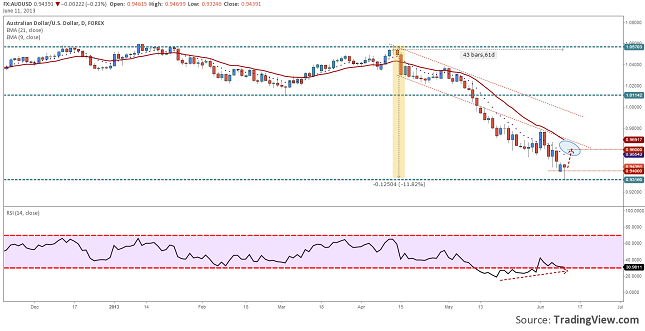
I really find the chart of AUDUSD pretty interesting. The Australian economy gave bad signals, so the RBA cut the interest rates at record low. They seem to need a weaker dollar to help restart the economy’s engine. The AUD dropped 12% in 61 days in front of the US dollar and this might not be the end of the drop. It can fall even more if the economy keeps on giving bad news and the Reserve Bank of Australian will cut the rate once more.
Chart: AUDUSD, Daily
Until the labor market reports will be published on Thursday, there might be enough time for a correction. Looking at the latest price action we will see that the trend seems to be a little exhausted after the dip. Talking into consideration that the 14 days RSI is showing a positive divergence (the RSI made higher lows, while the price made lower lows), a rally might just be on its way.
From my experience I have never trusted just an indicator, without checking the price action. I would, also, never recommend analyzing a chart based just on indicators to anyone else. So what is the price action telling me? Well, first I saw that 0.9400 is a good support level. The Monday opening was under this level, but the close of the day was above it. Today the price slipped under this level, but we can see than is above it again. So a daily close above 0.94, and a candlesticks which will resemble a Hammer formation would be my confirmation.
How nothing is 100% sure, I can just say that with a price action confirmation the probability for an analysis to be correct rises. If the conditions I have mentioned earlier will be fulfilled we can expect an up move which can retest 0.96. A level found in a pretty interesting resistance layout, created from a 21 EMA, 9 EMA and a rejection line of an ex channel, possibly a current trend line.
FX: AUDUSD Positive RSI Divergence confirmed by Hammer by Razvan Mihai


