| M2 Money Stock y/y |
3.3% |
3.1% |
3.1% |
| CGPI y/y |
0.0% |
-0.2% |
-0.5% |
| 30-y Bond Auction |
1.78|3.6 |
1.49|3.6 |
|
| Prelim Machine Tool Orders y/y |
-24.1% |
-21.5% |
|
| Tertiary Industry Activity m/m |
-1.3% |
-0.6% |
1.2% |
| Consumer Confidence |
44.5 |
45.8 |
44.8 |
| Prelim GDP q/q |
0.9% |
0.7% |
0.0% |
| Prelim GDP Price Index y/y |
-1.2% |
-1.0% |
-0.7% |
| Revised Industrial Production m/m |
0.9% |
0.2% |
0.2% |
| Core Machinery Orders m/m |
14.2% |
3.1% |
4.2% |
Improvements are starting to appear. We can see that the economic calendar is mainly green. Money Stock, Prelim GDP, Revised Industrial Production and also Core Machinery Orders were above expectations.
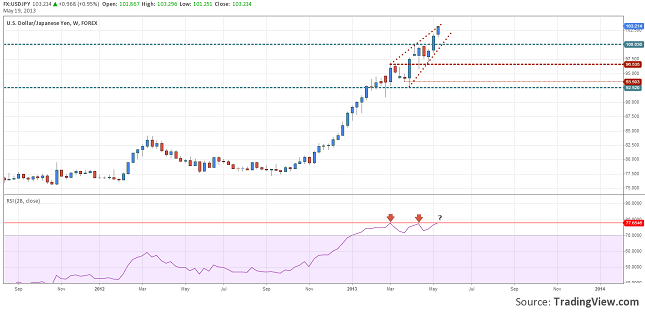
This good economic data did not help the yen. It has continued to depreciate in front of his most traded peers, but especially in front of the US dollar which was also the preferred currency of the week. USDJPY has passed over the 103.00 barrier and seem to continue this up move.
Looking at the chart we will observe that on a weekly time frame the price has formed a Rising Wedge. The 28 periods RSI is consolidating right under 77.65, another bounce from here might signal a fall in the price that could retest the 100.00 level.
Wrap Up 13-17 May USDJPY Up 1.32% by Razvan Mihai


