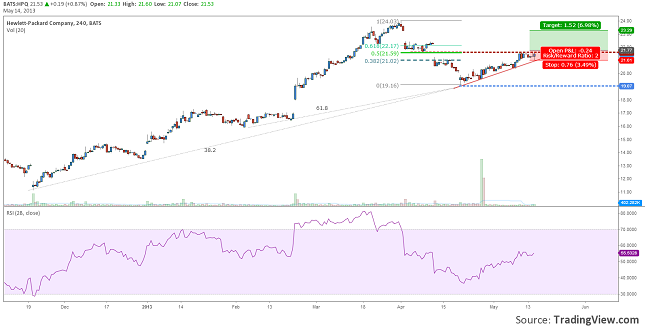
Interval: H4
Hewlett- Packard (HPQ) price chart looks pretty interesting. The latest corrective move of the main up trend has ended at a Fibonacci cluster formed of 38.2 retrace of the full trend and from 61.8 retrace of the last impulse started In March 2013.
The up move started on 19th of March took a short break right under 50% retrace of the correction and at ex support line. If the pressure gathered here will be released on the up side then we could see a rally back to the highs, confirming a new impulse. For a confirmation we should wait for a breakout over 21.70, the current resistance.
Confirmation Level: 21.77
Take Profit: 23.29
Stop Loss: 21.01
Trade Setup Hewlett-Packard Co. on Trend Continuation by Razvan Mihai


