
Interval: Weekly
By evaluation standards it seems that Garmin’s shares are still too expensive, even after an impressive price drop. If we take a look at the evolution of Google Maps or the iOS mapping system, we will easily understand that the future is not that bright for Garmin Ltd.
In the future its earnings are expected to shrink. The analysts were hoping for the 2013 EPS to be around $2.83, but now the company is expecting $2.30 to $2.40. The dividend is programmed for 29th of March, at 45 cents per share. It is the fourth quarter with the same dividend for the company.
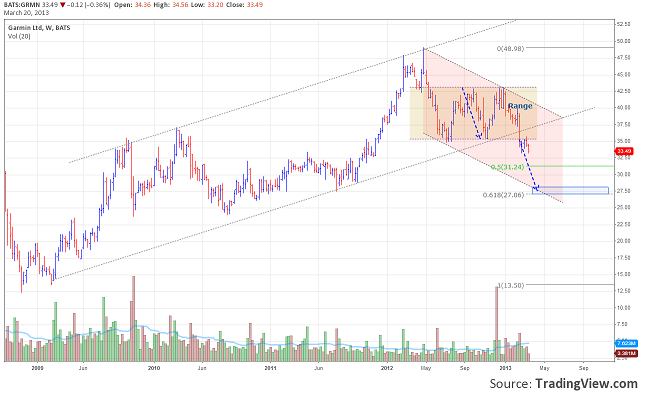
Its chart doesn’t look good at all. The current low, 33.20, is also the 52 week low and the probability for it to be taken down is quite high. The price has broken the 4 years up trend’s line and a support of a nine month range in one day, accompanied by high volume.
The target for this range breakout is situated at 27.06, 61.8 Fibonacci retrace of the entire trend. In the same zone it can be found the resistance line of a down channel. For the price to get there, a primary condition is the current support level (33.20) to be broken. After that, the nearest support is the 50% retrace at 31.24.
The price action of the latest evolution suggests me that this might be the beginning of a new beautiful down trend.
Garmin Ltd Looks Bad On Trend Line Breakout by Razvan Mihai