Technical Overview on the Forex Majors before the Show

As we wrote in our post “What is to be Expected Next Week for the Forex Market?” this week’s economic calendar will be more crowded starting with Tuesday. Today the most important data came from Japan. It’s GDP rise only 0.6%, despite the expectations of 0.9%.

USDJPY has consolidated between 96.00 and 97.00 after a falling 4.16% from almost 100.00. The drop broke the rejection line of the down trend and started to draw a rectangle. From the current price action the higher probability is on the down side. A 240 minutes candle close under 96.00 could trigger another drop which will target the 94.00 level.

A recovery of the US dollar would mean a breakout above the 97.00 level. If this will occur we should look also for a close, to have a certain confirmation. On this scenario, the upper target sits around 98.50.
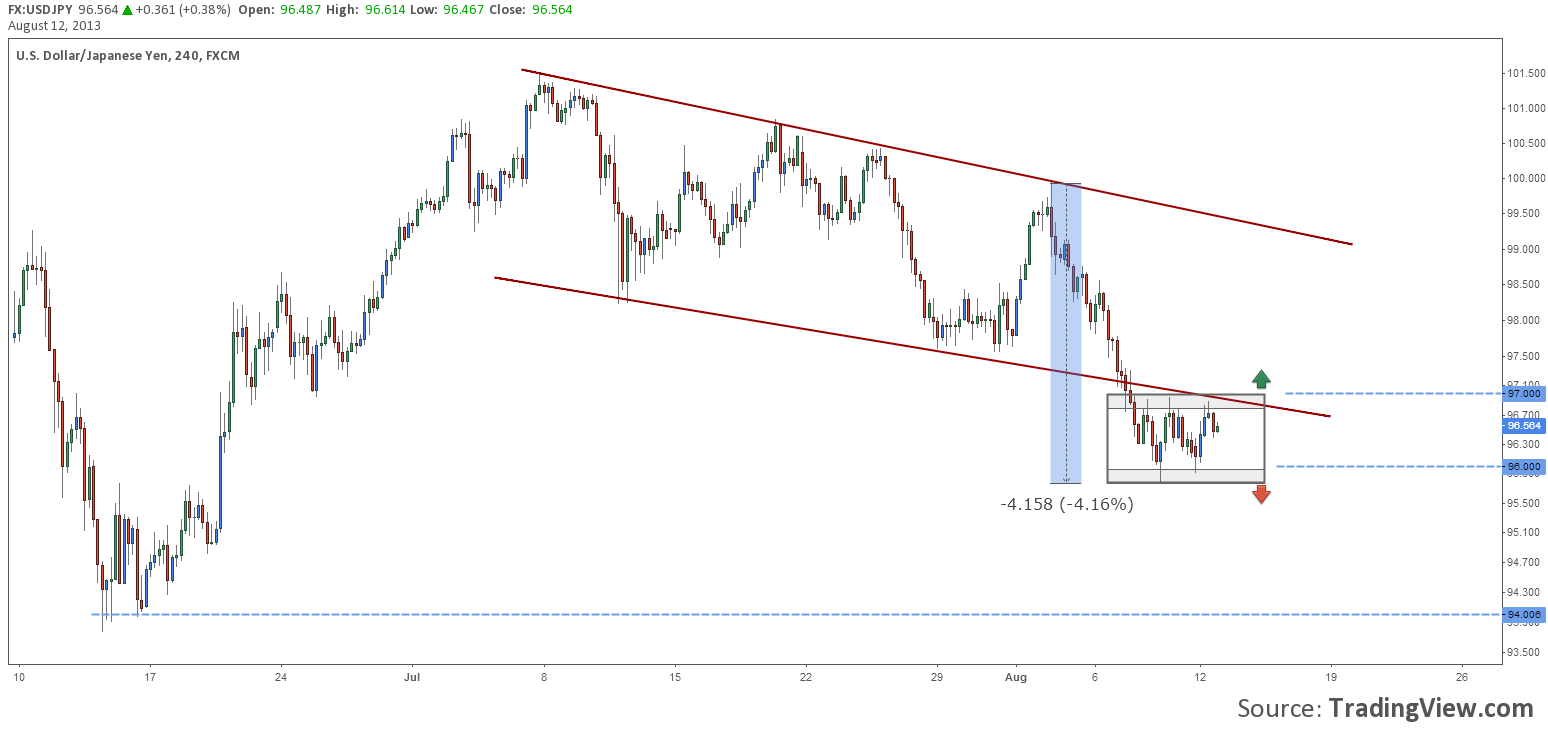
usdjpy-consolidated-under-rejection-line-12.08.2013

Chart: USDJPY, H4

Next is GBPUSD. This currency pair had an interesting evolution during the past moves. The up move was not straight but the price managed to get back to 1.5600. Here it has found a pretty good supply enforced by the round level and a down trend’s line.

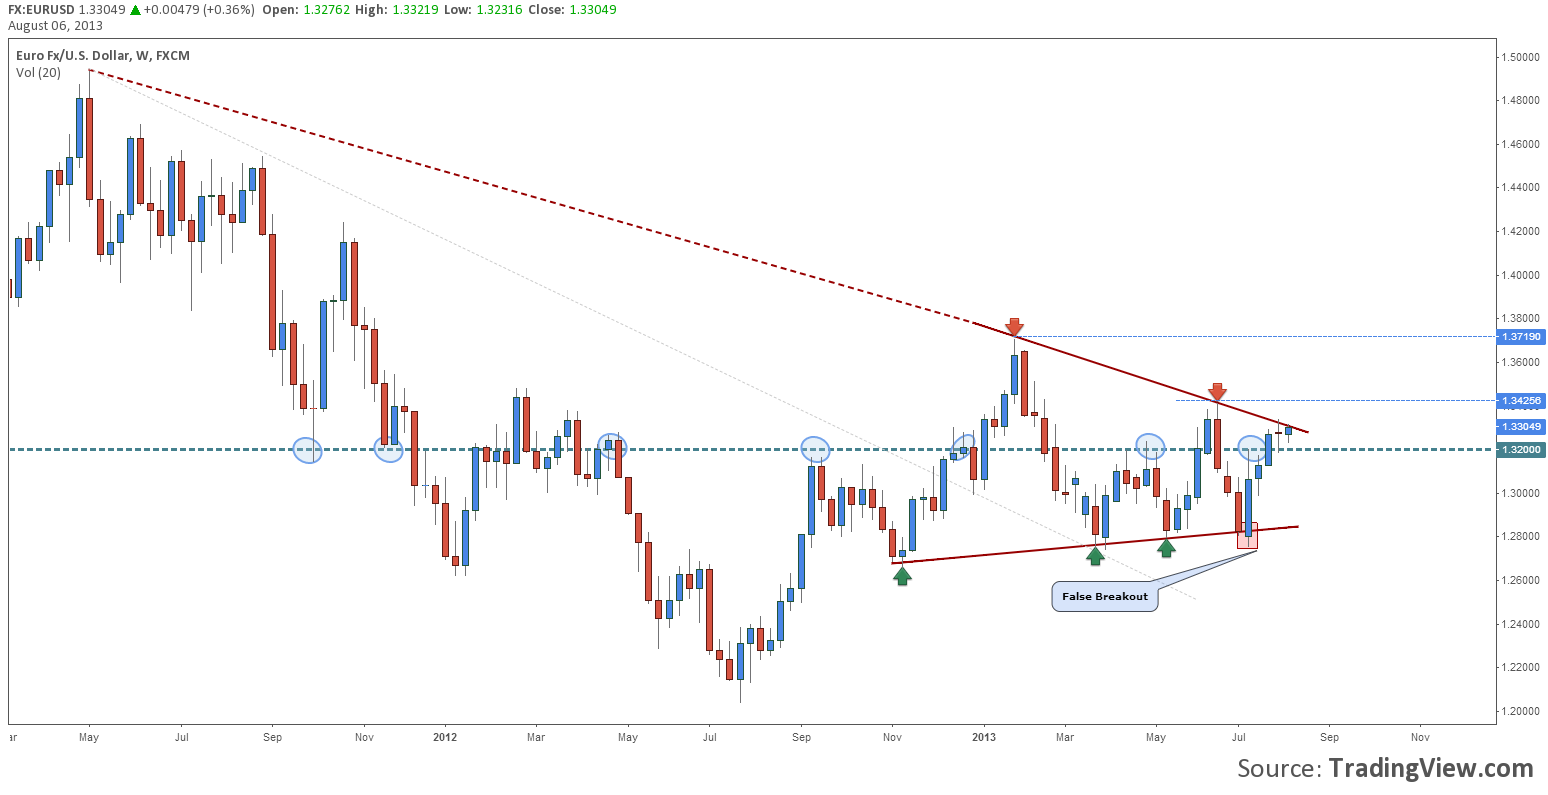
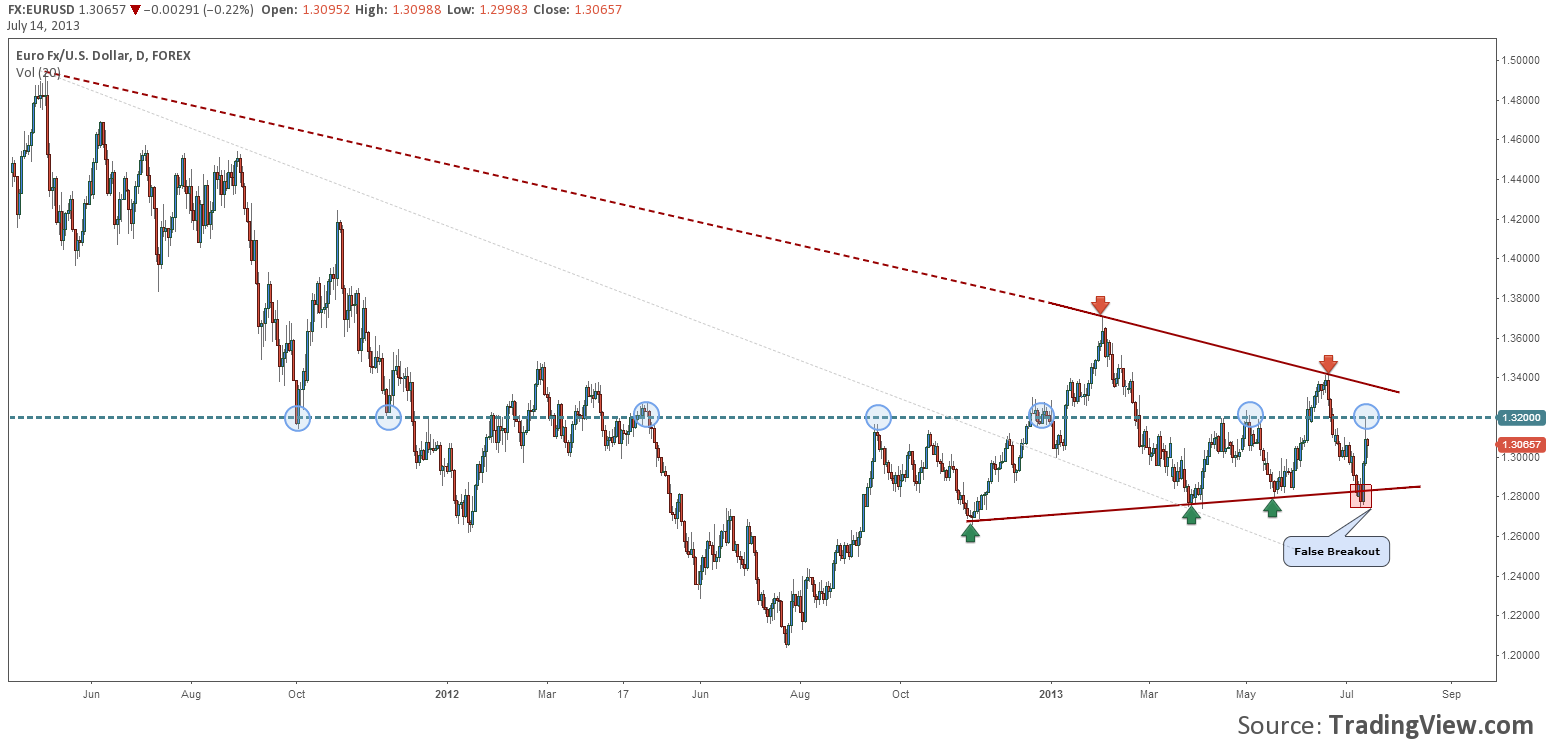
Looking at the price action from January 2013 we will observe a consolidation that resembles pretty much with a Descending Triangle. This pattern would be confirmed only by a breakout under its base line or above the upper line. At the current moment the most probable would be a break above the upper line. If the price falls under 1.54 then we should look for a target around the demand area at 1.4840.

gbpusd-forcing-the-upper-line-12.08.2013

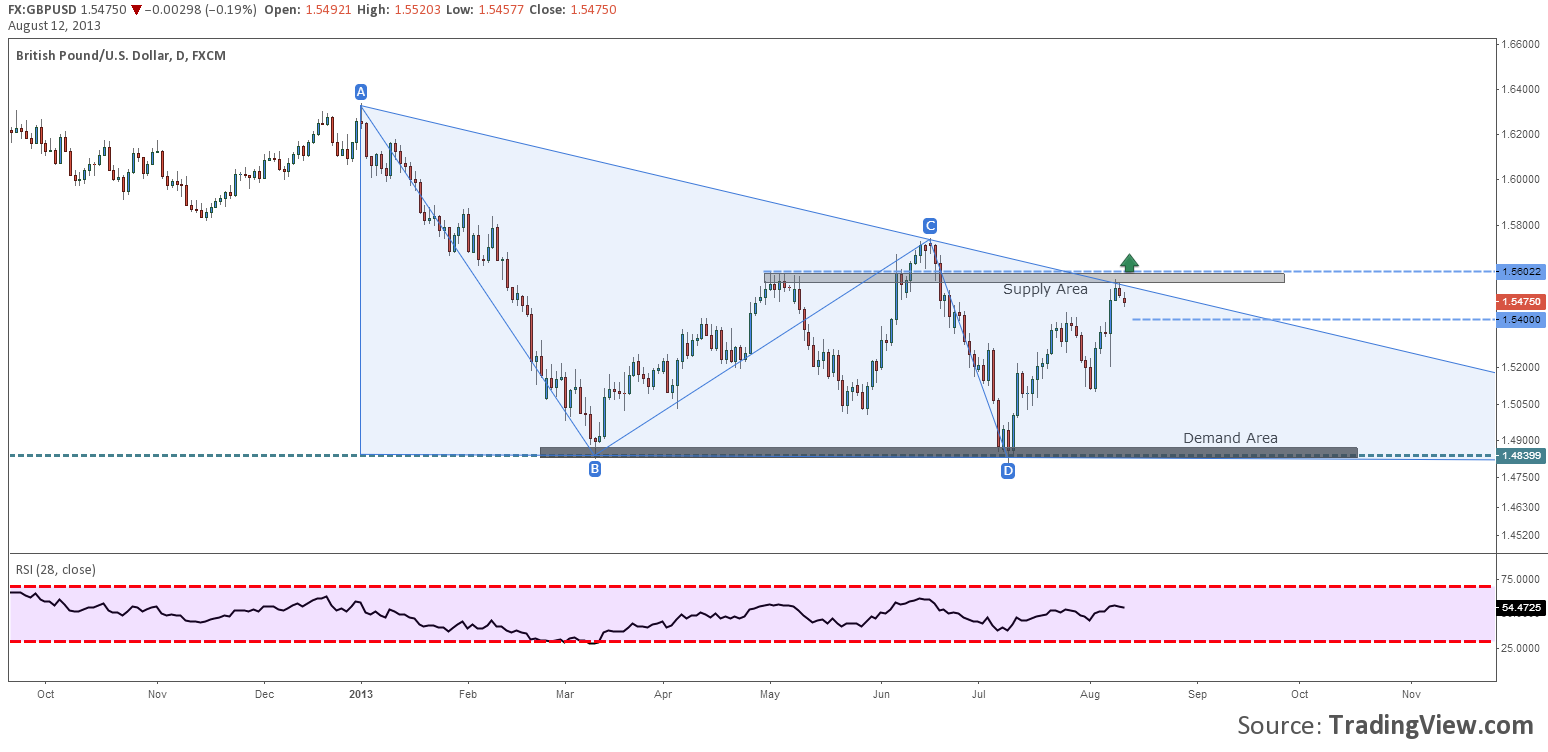
Chart: GBPUSD, Daily

A good technical image for AUDUSD would give us the 240 minutes time frame. Here we spot two converging lines that were respected by the fall of the price. On Friday, the trend line was broken, but because the price did not go too far, it was quickly retested today.

[Read more...]

3 Stocks you Should keep an Eye on

Walt Disney Company

disney-hesitating-after-150-percent-rally-09.08.2013

Chart: DIS, Daily

From October 2010 the price of Walt Disney Company shares started a bullish market. Ten months later, the price has gained 150% after reaching 67.70$ per share. From May 2013, when the price peaked, a triangle consolidation has started.

At this point the pressure seems to be o on the lower line of the triangle. A breakout and a daily close under this line could signal a 9.5% drop back to the trend line. Do not rule out the possibility of a false breakout on the lower line and a rally above the upper line and resistance. In any of the scenarios there is a good opportunity for taking some profits.

Coca-Cola Company

coca-cola-in-an-up-channel-09.08.2013

Chart: KO, Weekly

Let’s pass to our next company, Coca Cola. Another bearish market that lasted more than 4 years and the price of the shares rallied almost 150%.

At the current moment a corrective movement started that brought the price at the middle of the up channel. It has found a support at 39.60$, but it might move lower to test the trend’s line. The best opportunities for this stock would come with the breakout under the trend line, signaling this way the start of a possible bearish market, or a breakout above the 41.20$ resistance that could mean the continuation of the trend.

MasterCard Inc.

mastercard-signaling-exhaustion-09.08.2013

Chart: MA, Weekly

The last but not least is MasterCard Inc. This company’s share price rallied in less than 3 years almost 250%. It is an impressive market with no important corrections.

This trend might continue for the next three years, only that there are some bearish signals. The price has got close to 700$ per share, the 28 RSI entered an overbought area and the volume started to drop as the chart shows it.  This signals are not enough to take action at this point, but a drop under the trend line (do not forget the chart is drawn on a logarithmic scale) or a candlestick formation could confirm our current signals.

If the signals will be confirmed, a fall back to 500$ per share would be imminent. In this case a shorting opportunity would appear.

If you are not fans for short selling you can always use options to trade this kind of patterns.

Is the Euro Overbought or the Uptrend is Sustained?

Well, let us see what are the premises? For the Euro Area we had some very good PMIs published this month, lower unemployment rate and Germany surprised with better than forecast industrial production, trade balance, factory orders and unemployment change. Furthermore the ECB maintained the interest rate unchanged and Mario Draghi recovered his optimism in what concerns the economic evolution of Europe.

Adding to this the fact that Federal Reserve is still maintaining the Quantitative Easing program unmodified we can say that there are reasons for the investors to go long Euro and short the US dollar.

In every FOMC statement and speech of Ben Bernanke it is said that Fed will continue the QE as long as it is necessarily for the labor market to get back on its feet. On the other hand the officials that gave statements to the press believe that the tapering of the program will start in September, because the unemployment rate started to drop and there are signs of economic recovery.

Bering this in mind, we believe that this uptrend will continue until the Fed will announce the tapering of the stimulus and the date that will end the QE.

So to answer our question: The Euro is not yet overbought, but the uptrend might not be sustained for a long period of time.

From the technical point of view, the price has breached above Friday’s top and almost hit 1.3400. For today it seems that the rally stopped. If this week will close above 1.3350 it will confirm the break above the higher line of the symmetrical triangle (you can find more details reading EURUSD Dragged Towards 1.34 on QE Continuity) and also signal that the uptrend could continue for the rest of August.  A false breakout could bring the price back to 1.33 or even lower.

eurusd-overbought-or-trend-is-sustained-08.08.2013

Chart: EURUSD, H1

Looking at the lower time frame we can see that the price has reached a resistance area at 1.3400/20. Adding the overbought in the RSI evolution we should open the eyes for a pullback. A break above the resistance could open the way for another rally that is targeting 1.3500.

EURUSD Dragged Towards 1.34 on QE Continuity

Last week the FOMC statement showed that Federal Reserve officials are still on the Quantitative Easing side. It seems that the QE is expected to be shut down only if the unemployment rate will drop to 6.5% or if the inflation rate will rise 0.5% above the medium target. Keeping in mind that the United States has an unemployment rate at 7.4% we can say that it might take a while until the end of the program or at least until the tapering. On Thursday the unemployment claims surprised with a value of 326K (under estimates) while on Friday the Non-Farm Payrolls came at 162K, with 20K lower than the forecast.

On Thursday the ECB maintained the interest rate a record low 0.50%. The main ideas from Draghi’s press conference were:  the ECB will continue to keep low interest rates and high liquidity, will keep the door open for new rate cuts and forecast a slow recovery at the end of the year and in 2014.

The latest economic releases for the Euro Area were mainly above expectations: a lower unemployment rate, higher PMIs for both manufacturing and services sectors and better industrial production for Germany.

eurusd-dragged-towards-1.34-06.07.2013

Chart: EURUSD, Weekly

Looking at the EURUSD we can see that the pressure is now on the upper line of a symmetrical triangle. Last week was a Doji candle above 1.3200. If this week will close above 1.3345, last week’s high we might see a rally toward 1.34 or why not even higher to 1.35. A false breakout above 1.34 could signal a reversal.

USD or JPY what would traders choose?

usd-or-jpy-which-investors-will-choose-17.07.2013

Chart: USDJPY, H4

From the top of this year, hit in May, the US dollar lost about 9.5%. It managed to recover about 78% of this fall after Federal Reserve announced that it will start tapering the QE program this year and stop it in 2014.

Yen is becoming a week currency because of the monetary easing started by BoJ. The program already shows an improvement in Japan’s economy so the Central Bank will maintain it a current values until the end of the year. They are targeting deflation and the devaluation of the currency, in their opinion, is just the effect.

During the past 7 days USDJPY has consolidated in a symmetrical triangle right under the 78.6 retrace of the latest impulse of the main uptrend. This means that investors are not yet convinced in which currency to invest. While they are waiting for further signals from the Central Banks, we can look for technical signals to understand in which they will invest next.

If the price will break the upper line and close on a 240 minutes time frame above it could trigger a new rally for the US dollar and target the 102.00 price. On the other hand, if the price will close under the lower line we might witness a drop to 96.70 (the 61.8 Fibonacci retrace of the uptrend).

EURUSD Was Not Yet Ready for…

In the first week of June, Mario Draghi said that ECB will keep the interest rates at record low for an extended period of time and there are arguments for it to be cut even more. In the same week, on Friday the Non-Farm Payrolls surprised the market with a value above all forecasts. The dollar got stronger and stronger, managing to get the EURUSD quotation under 1.2800.

The story does not end here. Last week, the second week of the month, were published the FOMC Meeting Minutes and Ben Bernanke had a speech titled “A Century of US Central Banking: Goals, Frameworks, and Accountability”. Investors were disappointed to see that, in the minutes, there was no date from which Fed will start tapering the monetary easing program. The full attention was moved to Ben’s speech, but nothing was said about any dates. This time the dollar started to lose and in several hours EURUSD got back over 300 pips.

Next week Ben Bernanke will testify on the Semiannual Monetary Policy Report before the House Financial Services Committee, in Washington DC

eurusd-was-not-ready-for-a-breakout-14.07.2013

Chart: EURUSD, Daily

Looking at the price action of EURUSD we can say that it wasn’t ready to break out from the consolidation pattern, which is actually a symmetrical triangle.  The lower boundary is around 1.28 level while the upper one sits at 1.34. The main axis, as it can be seen on the chart, is 1.3200. This level seems to be the equilibrium one.

If the price breaks above 1.32 we can expect for it to test the upper line of the triangle, while if it drops or remains under the pressure rises on the lower line of the pattern.  This currency pair will remain sensible to the economic data published from the United States and will the volatility will increase during the speeches of Mario Draghi and Ben Bernanke.