Is the Euro Overbought or the Uptrend is Sustained?

Well, let us see what are the premises? For the Euro Area we had some very good PMIs published this month, lower unemployment rate and Germany surprised with better than forecast industrial production, trade balance, factory orders and unemployment change. Furthermore the ECB maintained the interest rate unchanged and Mario Draghi recovered his optimism in what concerns the economic evolution of Europe.

Adding to this the fact that Federal Reserve is still maintaining the Quantitative Easing program unmodified we can say that there are reasons for the investors to go long Euro and short the US dollar.

In every FOMC statement and speech of Ben Bernanke it is said that Fed will continue the QE as long as it is necessarily for the labor market to get back on its feet. On the other hand the officials that gave statements to the press believe that the tapering of the program will start in September, because the unemployment rate started to drop and there are signs of economic recovery.

Bering this in mind, we believe that this uptrend will continue until the Fed will announce the tapering of the stimulus and the date that will end the QE.

So to answer our question: The Euro is not yet overbought, but the uptrend might not be sustained for a long period of time.

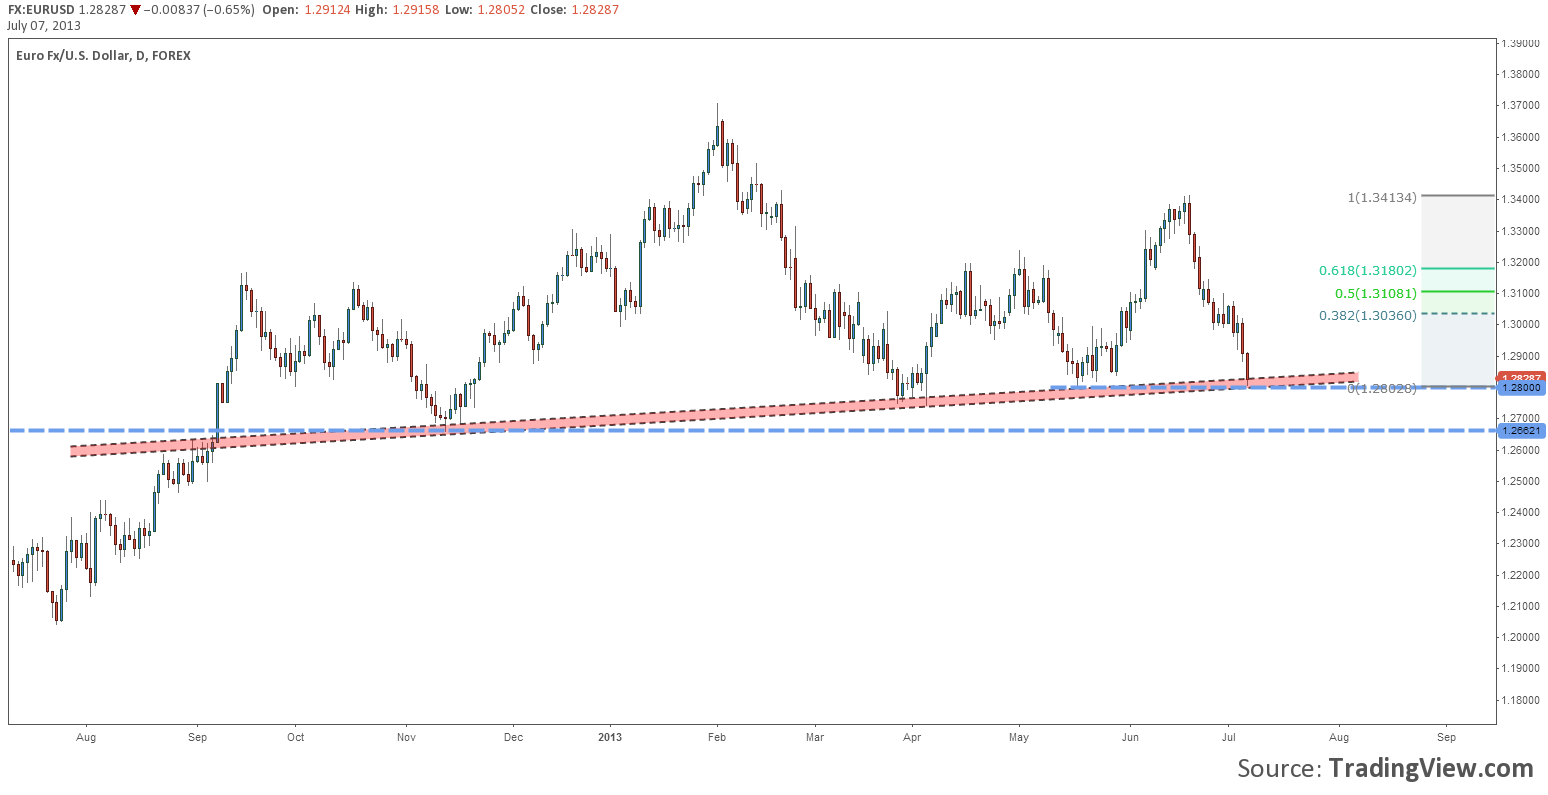
From the technical point of view, the price has breached above Friday’s top and almost hit 1.3400. For today it seems that the rally stopped. If this week will close above 1.3350 it will confirm the break above the higher line of the symmetrical triangle (you can find more details reading EURUSD Dragged Towards 1.34 on QE Continuity) and also signal that the uptrend could continue for the rest of August.  A false breakout could bring the price back to 1.33 or even lower.
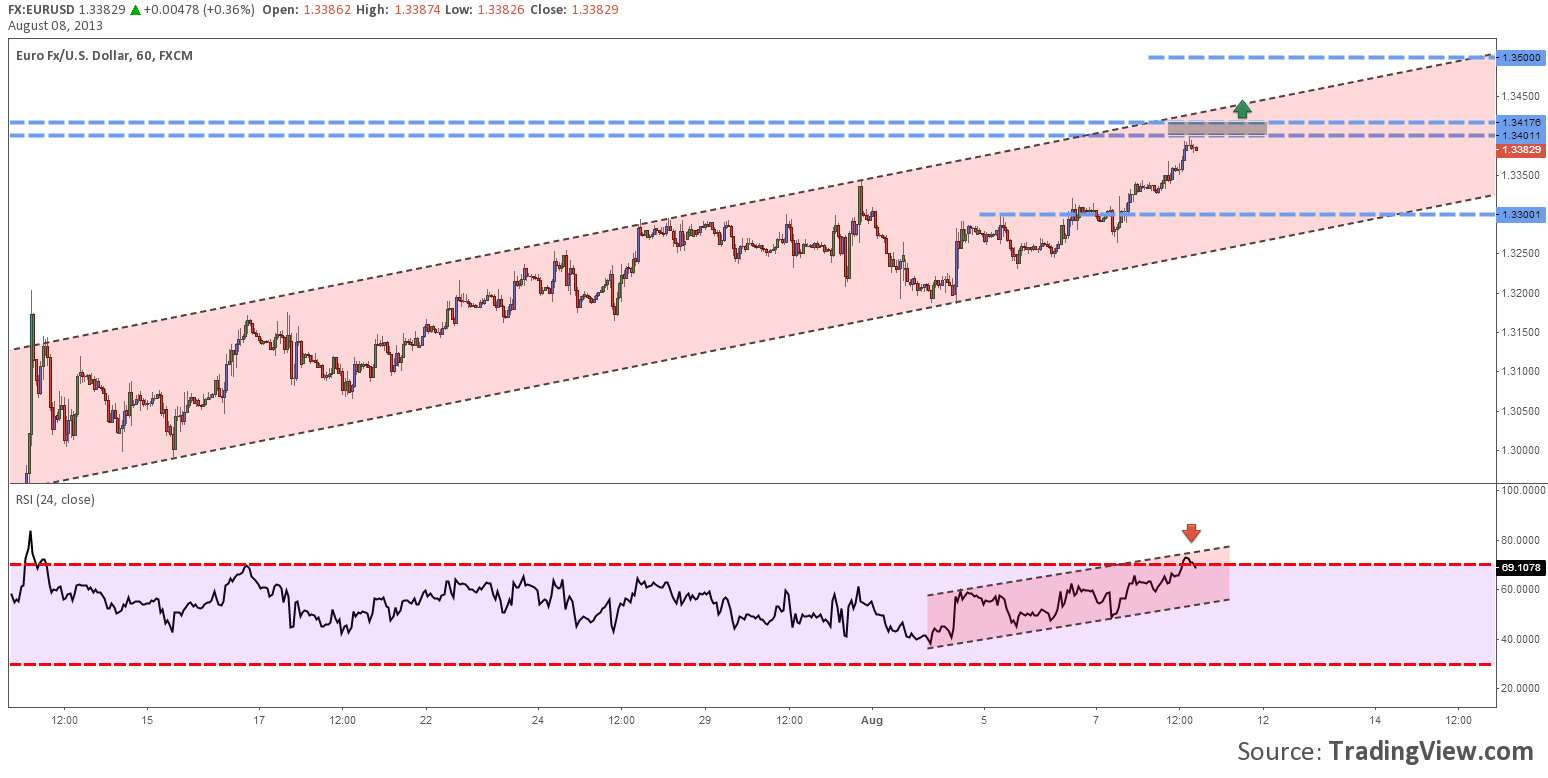
eurusd-overbought-or-trend-is-sustained-08.08.2013

Chart: EURUSD, H1

Looking at the lower time frame we can see that the price has reached a resistance area at 1.3400/20. Adding the overbought in the RSI evolution we should open the eyes for a pullback. A break above the resistance could open the way for another rally that is targeting 1.3500.

Gold (XAUUSD) might Bottom around Current Levels

gold-sitting-under-ichimoku-resistance-16.07.2013

Chart: XAUUSD, Daily

After hitting a low under 1180$ per ounce the price of Gold bounced back to 1290$ per ounce. The most interesting thing about this throwback is that the commercials are still net short on this instrument, but the open interest is on the up move. This might mean that the precious metal is being bought by private investors more, and less by Central Banks and Hedge Funds.

Tomorrow Ben Bernanke is expected to have another speech. Investors will look for signals regarding the Quantitative Easing. If the Fed will start tapering it later than September, we might see another rally in the price of gold, while if this date will be maintained there is a possibility for the price to drop suddenly.

Looking at the technical analysis of gold’s price chart using a system based on Ichimoku Kinko Hyo, we observed that the price is now in the layer between the Tenkan-sen and Kijun-sen averages. Adding a Fibonacci retrace we can conclude that 1300$ per ounce is a very good resistance level. If the price will break and close above this level we can expect for it to rally to 1350$ per ounce, where it will find itself in the Kumo.

Even though the signals are bullish, keep an eye on the 1270$ support. A break under this level could mean another drop for the price of gold. The target levels for a down move are 1210$ and 1180$ per ounce.

Should We Believe in Japan’s Recovery?

The press conference of Bank of Japan announced its optimistic view concerning the next 2 years period. In this matter, the latest data about Japan came better, together with the successful implemented quantitative easing, promise to keep Japan safe. Thereby, an increase in exports and public investments along with a moderate increasing in industrial production and accommodative financial conditions have great potential to lead in maximum 2 years to the targeted 2% inflation. The monetary stimulus activity has been shown to have great results so far and is being maintained for the moment with the possibility of adjustments. Moreover, the International Monetary Fund rised its forecast for Japan from 1.6% to 2% growth this year, becoming the only bright economy from the Group of Seven industrialized economies.

On the other hand, the slowing economy of China is posing serious problems, as well as the weak Europe, the fragile United States and the weakening of the commodity-exporting economies.

Is Gold going to Rally Back to 1300$ per Ounce?

gold-consolidated-in-triangle-10.07.2013

Chart: GOLD, H4

As it looks now, in our opinion, the answer would be not yet. The FOMC meeting minutes showed that there are more members that agree with the tapering of the Quantitative Easing program, but it wasn’t specified the date for the start of the tapering. The speculated date was September this year, but it seems that the Federal Reserve has to see whether the unemployment rate is heading to 7%.

After the Minutes the dollar lost some ground, gold rallied to 1265$ per ounce but didn’t stay too much there. In less than an hour Ben Bernanke will have a speech and the investors will keep their eyes and ears focused on what the Fed’s chairman is going to say.

From the technical point of view, the price of gold encounter a good resistance area at 1268.00 level, that was tested 2 more times in the past 3 weeks, and could not pas. The bounce off 1265$ might mean that the pressure is still on the downside, even though it can be spotted an Ascending Triangle price pattern on the chart.

To wrap it up, during the speech of Bernanke we will look at the support 1243.30 and resistance 12568.45 key levels. Under the support the targets will be 1220.00, 1200.00 and 1180.00, while above resistance the price targets would be 1302.45 and 1350.00.

How Did The EURUSD Dropp 1.48% Last Week?

A really important week has passed for the EURUSD currency pair. As we know, in the first week of the month the ECB has the monetary statement and the press conference and the Non-Farm Payrolls is published for the United States.

At this press conference Mario Draghi pointed some things regarding the positioning of the ECB in what concerns the economy of the Euro Zone:

  • Euro Area growth risks remain on the downside
  • Inflation risks are broadly balanced, inflation rates may be volatile throughout the year
  • Economy should recover at subdued pace
  • 0.50% interest rate was maintained, but it is not the lower bound
  • The rates to stay low for extended period of time
  • ECB keeps an open mind on negative deposit rates

If this wasn’t enough, S&P lowered Portugal’s outlook to negative from stable. The country’s current grade is BB and rating company sees one in three chance of ratings cut within the next 12 months, and the also see a deficit about 5.8% of the GDP for 2013.

For the United States the story is a bit different. Several weeks ago Ben Bernanke said that the Federal Reserve is preparing for tapering the Quantitative Easing Program by the end of 2013, and stop it in 2014. The conditions for these measures were that the economy to head towards their forecast and the unemployment rate to drop to or under 7%.

One day after the ECB’s press conference, the Non-Farm Payrolls was published. It surprised the market with a value of 195K vs. 165K expected, and the previous value revised to 195K. Even though the Unemployment Rate did not come as expected and stagnated at 7.6%, the biggest impact came from the NFP.

eurusd-at-1.28-support-after-ecb-and-nfp-07.07.2013-1

Chart: EURUSD, Daily

This week Euro dropped almost 1.5%. The biggest fall took place on Thursday and Friday. The speech of Mario Draghi did not encourage the investors to buy euros and the dollar continued its trend. Next day, the economic data showed an improvement in the US labor market, the dollar continued to appreciate.

From the technical point of view EURUSD got to a good support area, formed by 1.28 level and a trend line. The probability for the down trend to continue it is quite high. If this area will fall the next good support it is at 1.2650. Before a breakout we could see a bounce back to 1.29 or somewhere near 1.30.