Walt Disney Company
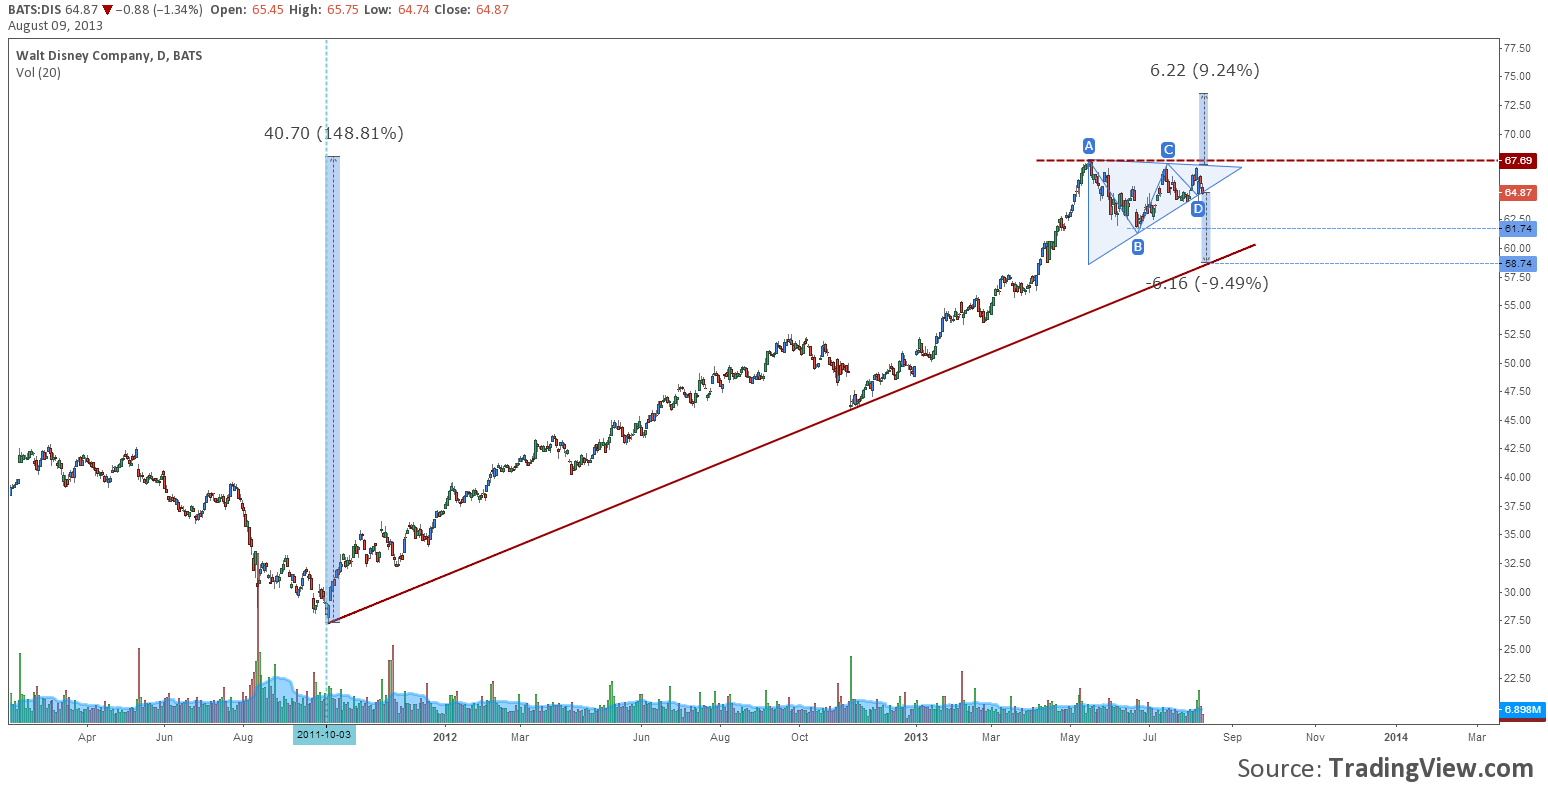
Chart: DIS, Daily
From October 2010 the price of Walt Disney Company shares started a bullish market. Ten months later, the price has gained 150% after reaching 67.70$ per share. From May 2013, when the price peaked, a triangle consolidation has started.
At this point the pressure seems to be o on the lower line of the triangle. A breakout and a daily close under this line could signal a 9.5% drop back to the trend line. Do not rule out the possibility of a false breakout on the lower line and a rally above the upper line and resistance. In any of the scenarios there is a good opportunity for taking some profits.
Coca-Cola Company
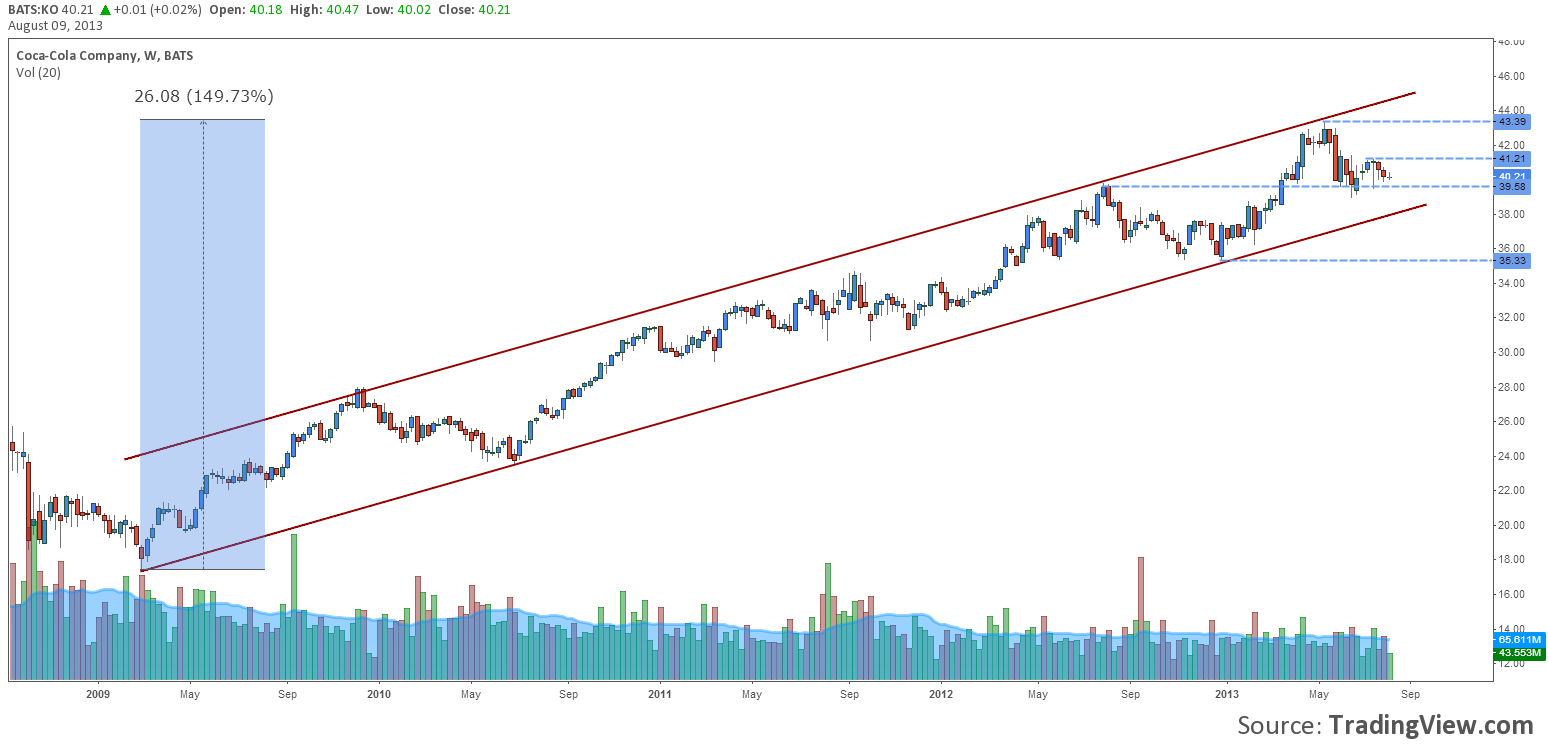
Chart: KO, Weekly
Let’s pass to our next company, Coca Cola. Another bearish market that lasted more than 4 years and the price of the shares rallied almost 150%.
At the current moment a corrective movement started that brought the price at the middle of the up channel. It has found a support at 39.60$, but it might move lower to test the trend’s line. The best opportunities for this stock would come with the breakout under the trend line, signaling this way the start of a possible bearish market, or a breakout above the 41.20$ resistance that could mean the continuation of the trend.
MasterCard Inc.
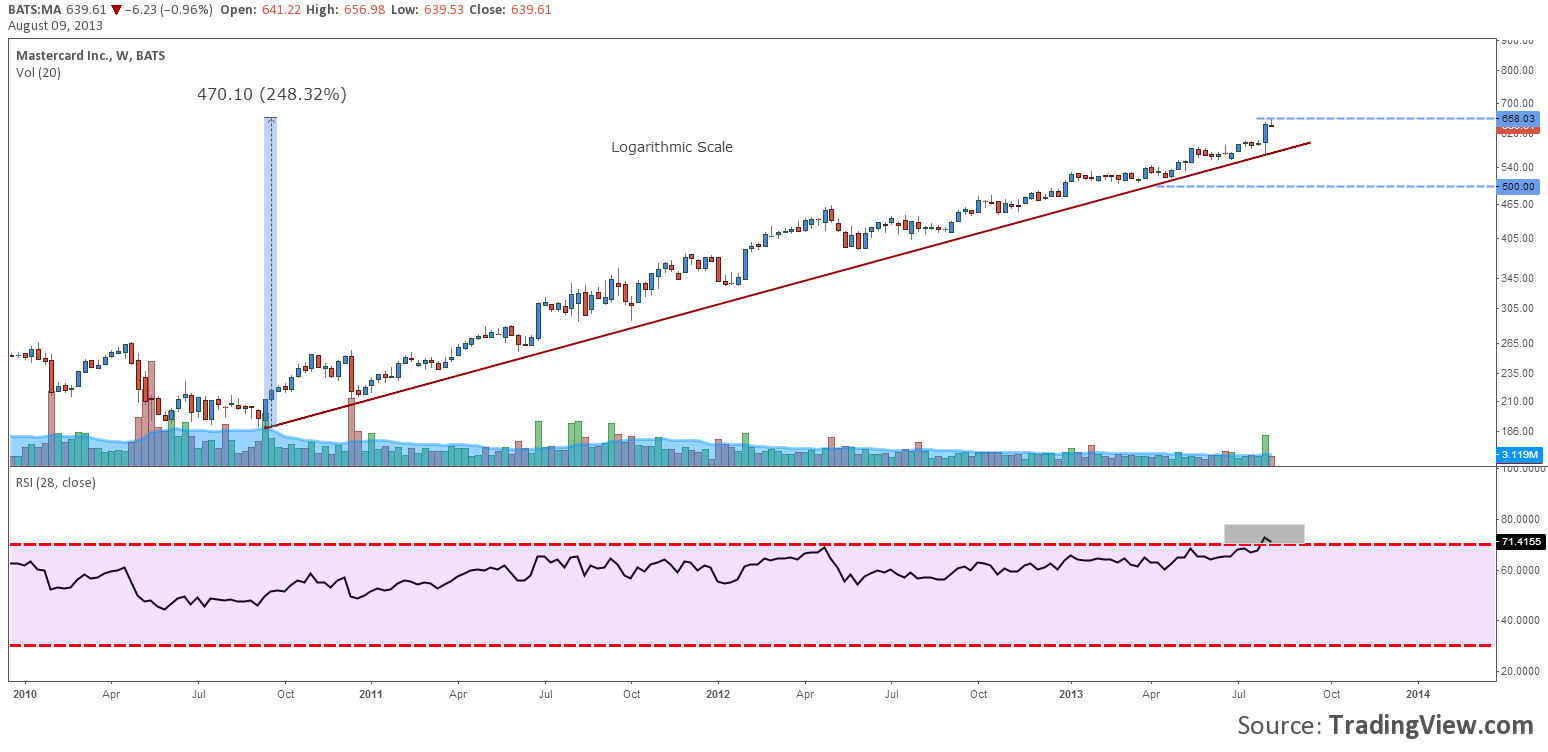
Chart: MA, Weekly
The last but not least is MasterCard Inc. This company’s share price rallied in less than 3 years almost 250%. It is an impressive market with no important corrections.
This trend might continue for the next three years, only that there are some bearish signals. The price has got close to 700$ per share, the 28 RSI entered an overbought area and the volume started to drop as the chart shows it. This signals are not enough to take action at this point, but a drop under the trend line (do not forget the chart is drawn on a logarithmic scale) or a candlestick formation could confirm our current signals.
If the signals will be confirmed, a fall back to 500$ per share would be imminent. In this case a shorting opportunity would appear.
If you are not fans for short selling you can always use options to trade this kind of patterns.
Connect With Us