Chart: GBPUSD, H4
From 16th of June the US dollar started to strengthen. In half a month it gained 3.75% in front of the British pound.
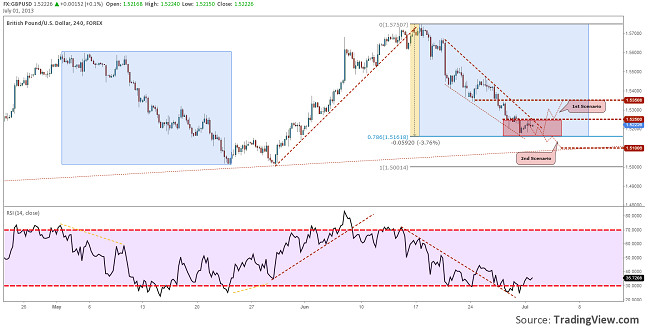
We can see that the down trend respected a clear line. On the troughs we can also draw a line, from now a Falling Wedge pattern became visible. This is not all, because the level where the price has stopped it is an important one.
At 1.5160 it is both the 0.786 Fibonacci retrace from the earlier up trend and the equality with the last down trend. Combining this with the fact that the RSI already broke its downtrend line and went under 30 level, we can say that there are some pretty strong reasons to think of a throwback.
We are expecting now a consolidation inside the 1.5160 and 1.5250 area. Our favorite scenario (1st scenario) would be a breakout through the local resistance and a rally to 1.5350 or, why not, 1.5400. But we should not forget that the Non-Farm Payrolls will be published on Friday and the dollar may go ballistic, especially if the data will be good.
If the dollar will get stronger the price might break the lower boundary (2nd scenario). In this case we expect a drop to 1.50 area, with a short pit stop at 1.51.