Forex Strategy & Forex Trading Strategies made by Professionals for Beginners & Experts

NASDAQ: Bed Bath & Beyond Inverted Head and Shoulders

Interval: Weekly

bbby-inverted-h&s-confirmed-13.03.2013

Bed Bath & Beyond Inc. (BBBY) is a chain of retail store and they are selling  usually domestic merchandise. The chain includes 1,173 stores in 50 states, some of them are Puerto Rico and Canada.

The company is occupying now #251 spot in S&P500, after taking McGraw-Hill Cos.’s place. It’s market cap is now 13.43 billion dollars. From a Reuters analysis it seems that BBBY shares have the potential to rise as much as 25 percent over the next year. This growth would mainly be based on strong profits. If world economy will start to pick up speed, especially in USA then this up move is pretty credible. And it is likely to attract the interest of some private investors, or even Berkshire Hathaway Inc,  which will buy premium shares,

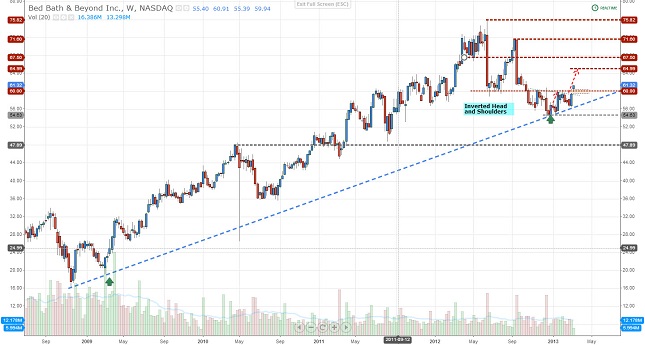
Looking on the price action evolution we can see that it has touched the uptrend’s line, after falling 22.6% from its latest high, touched in June last year. At the trend line the price has formed an Inverted Head and Shoulders, one of the most used reversal pattern. The price pattern was not only drawn, but also confirmed by a Breakaway Gap which got the price over the formation’s base, but also over the 60$ key resistance.

The targets for the up move are 65$ (the Inverted H&S target), 67.50$ the next resistance, 71.60 and 75.85 (the last top but would also mean a 25% growth from the current price).

NYSE: Heinz Trade Setup After 20% Jump

Interval: Daily

heinz-trade-setup-07.03.2013

Last year Heinz had realized a good profit after the sales went up to $11.6 billion. Now they are looking overseas for growth and are betting on the emerging markets, expecting a quarter of the company’s sales this year to account on them.

Their results attracted Warren Buffet and its partner on the deal (3G Capital, the investment firm that bought Burger King in 2010) to invest $23.3 buying Heinz. This news has sent the price of the shares from $60.5 up to $72.5 at the opening of 14th of February. Meaning  a 20% growth in an extremely short period of time.

From the technical point of view, we can see the up channel with a moderate degree, and after that a 12 dollars gap which have sent not only the price in the clouds but also the ROC (Rate of Change) and the 28 period RSI in the mega overbought zone.  Even though it has been a good news for the investors, the up move can’t be sustained for a long time now on without a correction.

This setup is triggered if the price will fall back under 71.80. The Stop loss would be set over the latest tops at 73.20 and the Target at the 66.70 level, meaning a 50% fill of the gap. The risk/reward ratio it is pretty good, 3.45.

NASDAQ: SBUX Harmonic Bearish Bat Pattern

Interval: Daiiy

starbucks-bearish-bat-harmonic-pattern-05.02.2013

The Starbucks stock displays on the chart a harmonic pattern in the form of a Bearish Bat.
Coming from PRZ there is a chance a rejection could take place and go back to 51.27. On 20 timeframes the average volume is going down for the move on the up direction to get the price in a place for reversal. A possible closing in the zone marked on the chart makes the Bearish Bat null and triggers a call for the continuation of the trend.

NASDAQ: AMZN Last Week’s Price Drop Leads to Bearish Engulfing

Interval: Weekly

amazon-bearish-engulfing-low-volume-04.02.2013

After taking a pretty big series of hits last week, the biggest online retailer Amazon has formed a Bearish Engulfing in the immediate zone of the superior line of the channel.

This could be a good signal for a correction intended to retest the 242.28 price level, also to sustain this scenario, we can see the down path of the volume after the impulse on the trend with a spike right at the last weekly drawn candle.

NYSE:HPQ Retesting Inverted Head and Shoulders

Interval: Daily

hewlett-packard-iverted-head-and-shoulders

The price of the Hewlett Packard stocks has formed a pretty nice Inverted Head and Shoulder.

After it broke its base, retested it. This can make a very nice trading setup. If the price will pass over the last top, it will have an open way to the target of the price pattern. We can set up the target at 17.46 and the stop loss under the base line of the pattern.