Forex Strategy & Forex Trading Strategies made by Professionals for Beginners & Experts

Simple Gap Trading Strategy for the Forex Market

The gaps that appear on a chart are pretty important. It is a price pattern which can offer information regarding the direction of the price and the strength of the market. On Forex, because of the high liquidity, gaps are not that frequent, but they do appear especially after the weekends.

In trading a myth, that the gaps are always covered, was born. The gaps are usually covered, but it can be done very fast or it can take a longer time until it will be covered.

It is important to know that there are mainly four types of gaps:

-          Common gaps, which usually appear inside a price pattern and they are easily covered (Head and Shoulders, Rectangle, Triangle, etc.).

-          Breakaway gaps, these gaps appear when the price breaks from a price pattern or above/under important levels and shows that the market is ready to continue the move and they are not that easy to be covered.

-          Runaway gaps, these are continuation patterns just like Flags and Pennants and are they are very hard to cover because of the strength and determination of the market to move forward.

-          Exhaustion gaps are announcing that the market has reached a limit and the current move might be reversed soon and this is why it is easier for this gap to be covered.

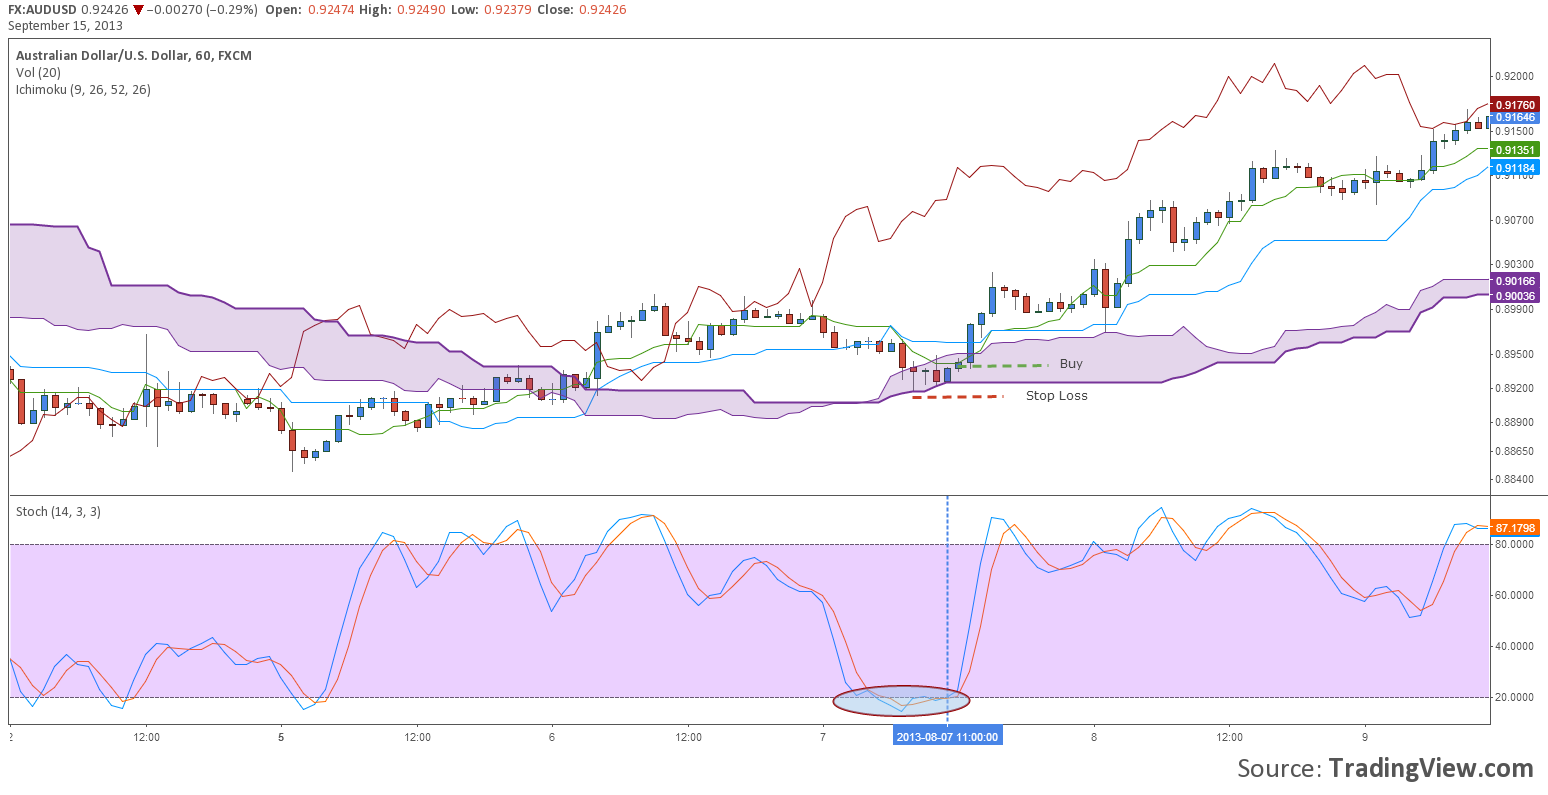
The strategy we recommend when trading gaps it is pretty easy. When a gap appears a trader should look for other technical elements that will tell him what kind of gap it is. If he managed to determine if it is a common, breakaway, runaway or exhaustion gap, then he should wait for another candle to be drawn.

An opening of a trade right at the opening of the gap it is pretty dangerous. If another candle or candles are drawn he can use the new low as a support level. A break through this level can be used as a trigger for the trade.  The Stop level can be set above a high; it can also be the closest one. As take profit the trader can set several levels. One can be the 50% of the gap and the second the high of the last candle before the gap.

See our example on the next chart:

simple-gap-trading-strategy-resiz-09.10.2013

Chart: EURUSD, M5

This system can be adapted for all Forex instruments and time frame. The trader should consider other elements like support/resistance for his stop loss and take profit levels. The gaps could be fully closed or just partial and that is why it would be better to take into consideration several TP levels. Do not forget to apply to this strategy also your money management.

How to Reduce Your Forex Trading Risk with Options Hedging

The Forex market has got a pretty bad reputation during the past several years. In my opinion this has happened because of the less transparent brokerage houses (saying it short scammers) and because the traders that get into this train believe that it is a short journey to becoming rich.

To become profitable on the Forex market you need first to study it. Learn what are the factors that move the market, how the price is made, find yourself a strategy, get some discipline and start practicing with a risk as low as possible. It can become a full time job, but if you think you will get yourself rich after a day, a week or even a year with risking too much and no discipline, you will find yourself thrown out of a running train.

Traders should try to risk as less as possible and leave the market to run in their favor as much as possible. It is easier said than done, because while trading with real money emotions like fear and greed tend to appear. When the trader is surrounded by these emotions he tends to do stupid things. We will tell you in the next paragraphs a method that will help you reduce your risk while trading on the Forex market, but no one can show you how to manage your emotions, and for this you need to practice, practice and practice.

A good strategy to diminish the risk on the trades made on FX is to buy different types of options on the same instrument. You could ask: why buy and sell on the same type of instrument? Well, it would be pretty difficult to get out of that hedge with a profit on a way or another.

A trader can use different types of options depending on the strategy that he uses and especially on the time that he expects to keep the trade opened. Let’s take some simple examples:

If a trader uses a scalping strategy and he would at some point try to catch a bigger move on a very short time interval (best example would be what happened yesterday, 18 September 2013, on the FOMC meeting), he could use a very fast binary option on the other direction. This way if the price would not go in his direction could catch a profit on the option evolution.

Let’s say that the strategy used is not a very short term strategy, is rather a system that offers signals for trades that could last up to several days. In this case the trader could use European Digital options (Above/Bellow a specific level or Inside/Outside a range) and set up an expiry date for the option close to the day that he estimates he will close the trade.

If the trader is a position trader then he would need to hedge his trades on a longer term. In this case it is recommended to be used the Vanilla type options (Call/Put options). This way he will be able to win if the trade would go against his direction.

One important aspect that should always be taken into consideration is the money management. The premium paid for the option should be less than the potential profit made on trading, let’s say the CFD. The payout for the option should be equal or bigger than the stop loss set on the CFD.

What Are the Recommended Trading Hours for Scalping ?

The best trading hours depend on the currency pair you choose to trade and on the technical strategy you prefer. It is a matter of personal choice between direction-less or choppy markets and highly liquid and directional markets. In order to make good choices about the time period which is best for one strategy or another, we will present you some general lines of best periods for Forex Scalping.

Generally speaking, scalping needs high volatility, but there are also trading strategies that work on low volatility instruments.

All time periods mentioned in this article are EST (New York Time).

In order to use strategies that need high level of volatility, you need to find the best moments on each exchange. This means that Euro, Britain’s Pound and Swiss Franc have high volatility when they are traded on London exchange. And the best moments of the day are particularly: 03:00 AM - 05:00 AM and 08:00 AM – 10:00 AM.

These two hours periods there show specific micro-trends caused by numerous market events and news releases appearing. These intervals are best to be exploited by scalpers because of the rapidly changing conditions and positions that can be used in order to maintain rapid openings and closings that become profitable. As an advice, it would be good to take profit of all strong trends also and exploit it as full capacity.

Moreover, the Australian Dollar, New Zealand’s Dollar and the Japanese Yen have high volatility when they are traded on Tokyo and Sidney exchange. Best times of the day: 07:00 PM – 11:00 PM.

It is advisable to go for small quick trades made successively and to avoid building up positions in order to have the best results.

The Canadian Dollar has high volatility when traded on New York’s exchange. Best times: 08:00 AM – 12:30 AM.

If you are wondering why the American Dollar was not mentioned, let me tell you that it can be traded in pair with the other currencies; its volatility being higher only when indicators of the US economy are published or when it is bought as safe heaven.

Also, important moments of high volatility are those when the macro-economic indicators are published for the each currency. Of course, it is important to know that high volatility is also present when macro-economic indicators with high impact on the previously mentioned currencies are published.

However, if you prefer strategies that use low level of volatility and side-way moves in the market, you definitely have to eliminate the time frames mentioned above. Low volatility can be generally found in all currency pairs, except during the moments of the day we previously mentioned.

Of course, the transaction’s duration should not be influenced by the things mentioned in this article. Each scalper will know for how long to maintain each entry, always taking into account the money management and risk management and being in accordance with the strategy preferred.

Previous << Advanced Forex Scalping Bollinger Strategy <<

Next >> EMA And Stochastic Scalping Strategy For USDJPY >>

Basic Ichimoku Trading System

This system can be put in the trend following category. It uses Ichimoku Kinko Hyo, a trend based indicator and a Stochastic that gives the buy and sell signals.

Because this system uses Ichimoku as the trend following indicator it would be recommended for the traders to apply this strategy on higher time frames, like 30 minutes, 1 hour and up to a month. The best part of the system is that it can be used on every type of instruments (from the most liquid – forex- to stocks and commodities that are not that liquid).

Let us talk now a bit about these two indicators. The Ichimoku Kinko Hyo it used with its default settings, because it usually gives the best signals with them. The Stochastic Oscillator can be adjusted, but we chose to leave it also at the default settings as it proved to work very well on higher time frames.

First step in using this strategy is to look for a trend. As long as the Ichimoku Cloud is under the current price, the trend is up; on the other hand if the Cloud is above the current price the trend is on a down slope.

Second step would be to follow the price action. When the price enters the Cloud, look for an oversold on the Stochastic.

basic-ichimoku-trading-system-resize-15.09.2013

Chart: AUDUSD, H1

As you can see in the example bellow, the price is above the cloud after a breakout. When it has retraced the Stochastic went under the 20 level. The trigger is the comeback of the oscillator above the 20 level.  Buy after the close of the candle that got the Stochastic back and set the Stop Loss under the latest low. If the Stop Loss will be set under the cloud, then the probability for it to be hit is even lower.

In what concerns the profit levels, there could be several of them. One Take Profit level could be the latest high, another could be set taking into consideration the money management and the most distant could be another intersection of the price with the Ichimoku Cloud.

This trading strategy can be used also in downtrends. The trader should wait for the price to be under the Ichimoku Cloud and the Stochastic to signal selling points inside the cloud. Pay attention to the sideways moves because this system could offer low probability trades.

Simple Breakout Trading System

Trading breakouts is usually pretty tricky. It can always become a false breakout that could ruin the trader’s trade, by hitting the Stop Loss. To use this kind of systems a trader should find a combination of elements that will lower the probability for a false breakout. As no system is 100% accurate there should always exist a Stop Loss to limit a possible loss.

For this strategy to work, we recommend using currency pairs (or other types of instruments) that usually have high volatility. It can be used on any time frame, but our favorite remains the 15 minutes.

First step is to find a strong upside or downside move, as you can see in the example bellow. The strong move usually suggests that investors are set on a direction. After you have spot such a move, wait for a sideways move (consolidation) that will not go below/above (depending on the primary move) the 23.6 Fibonacci retrace. If these two conditions are met the next move would be to set a buy stop several pips above the high, taking into consideration also the spread.

simple-breakout-trading-system-resize-09.09.2013

Chart: GBPJPY, M15

As you can see in our chart, if the Buy Stop is triggered the trader should set a Stop Loss order at the low of the consolidation. There can be several Take Profits levels. First would be a projection of the width of the range, and next could be a projection of the prior move. The second one can give the trader a wonderful risk to reward ratio.

Our example is on an up move, but this strategy can be applied also on a down move. The trader just has to follow the same steps and enter in a trade only if the conditions are met.

Trend Following Strategy Using Parabolic SAR

The strategy that we will present to you in this article is a trend following strategy that can be used on any liquid market, especially on the Forex market. It can be applied on any currency pair and almost any time frame (recommended time frames from 1 minute to 4 hours).

The technical indicators that are used in this strategy are a combination of trend following indicators and an oscillator. The system uses the Parabolic SAR (0.01, 0.01, 0.4) and MACD (11, 22 and 9) for signals and confirmations and the 224 EMA for recognizing the trend. Using a slow EMA the trader will now which is the direction of the trend and will avoid entering on the corrective movements that could end up in closing the trade with a loss.

System’s conditions:

  1. Look for the trend. If the EMA is above the price, then the trend is down and the trader should try to find only short entries. If the EMA is under the price then the trend is up and the trader should look for buying points.
  2. Look for a sell/buy signal given by the MACD or Parabolic SAR.
  3. Look for a confirmation of buy/sell signal from MACD or Parabolic SAR.

What did we mean in points 2 and 3? It will be very rarely the situations when the Parabolic SAR and the MACD will give the same signal at the same time. So the trader should look for a signal given by the MACD and confirmed afterword by the PSAR, or a signal given by the PSAR and confirmed by the MACD.

Let us take the next example:

trend-following-strategy-with-psar-resize-05.09.2013

Chart: USDJPY, M15

The price fell under the 224 EMA, meaning that the trend is down. On 27 August, at 5:30, the PSAR signaled a sell (the indicator has drawn a point above the price). After 30 minutes the MACD signaled also a sell (the Signal Line crossed over the MACD line).  The trader should have entered short on the next candle after the confirmation)

The Stop Loss can be set above the Parabolic SAR points. This indicator can also be used as a trailing stop for riding the trend as much as possible.

The exit points can be the reverse signal given by the PSAR, the crossover of the price with the EMA or even using the risk/reward ratio.

For the long entry a trader should look for the price to be above the EMA, for the MACD to signal a buy (the signal line to get under the MACD line) and the PSAR to signal also a buy (the PSAR points to get under the price)