
NZDUSD had the downfall we were warning about last week, but the bulls were hard to beat as the ascending trend continued Monday and Tuesday the 0.8700 level was hit. From that point all went downhill as even the macroeconomic data for New Zeeland did not help at all. The Building Consents fell with 1.7% which did not stop the investors to push the quotation higher.
Then, the ANZ Business Confidence indicator came with a reading of 67.3, which was lower than last month, so this was another disappointment. Also, the ANZ Commodity Prices m/m indicator was -0.1%. Eventually, the bears grew stronger and managed to push down the price around 0.8515 on Thursday. Then, the Friday came in with a worse than expected NFP and the price went up and closed the week around 0.8586.
Economic Calendar
NZIER Business Confidence (23:00 GMT)-Monday. This is a high impact indicator which is released quarterly and it is considered a leading indicator of economic health. The index is based on surveyed manufacturers, builders, wholesalers, retailers and service providers. Last quarter was published at 52 level which was the best reading in the recent years, so pay attention to it as it will cause some volatility.
Business NZ Manufacturing Index (23:30 GMT)-Wednesday. This is a medium impact indicator and is based on surveyed manufacturers. Above 50.0 indicates expansion, below indicates contraction. Last month was 56.2, so it is important to keep an eye in this indicator to see if the economic expansion from New Zeeland continues.
REINZ HPI m/m (10th-14th)-Wednesday. It measures the change in selling price of all homes. It is a leading indicator of the housing industry’ health because rising house prices attract investors and spur industry activity. Source does not have a reliable release schedule and this is why it is listed with a date range.
FPI m/m (23:45 GMT)-Thursday. It measures the change in the price of food services purchased by households. Although food is among the most volatile consumer price components, this indicator garners some attention because New Zeeland’s major inflation data is released on a quarterly basis. Last month was -1%, so this indicator will have its share of attention from the investors and may cause some volatility.
Technical View
NZDUSD, Daily
Support: 0.8515, 0.8425
Resistance: 0.8635, 0.8700
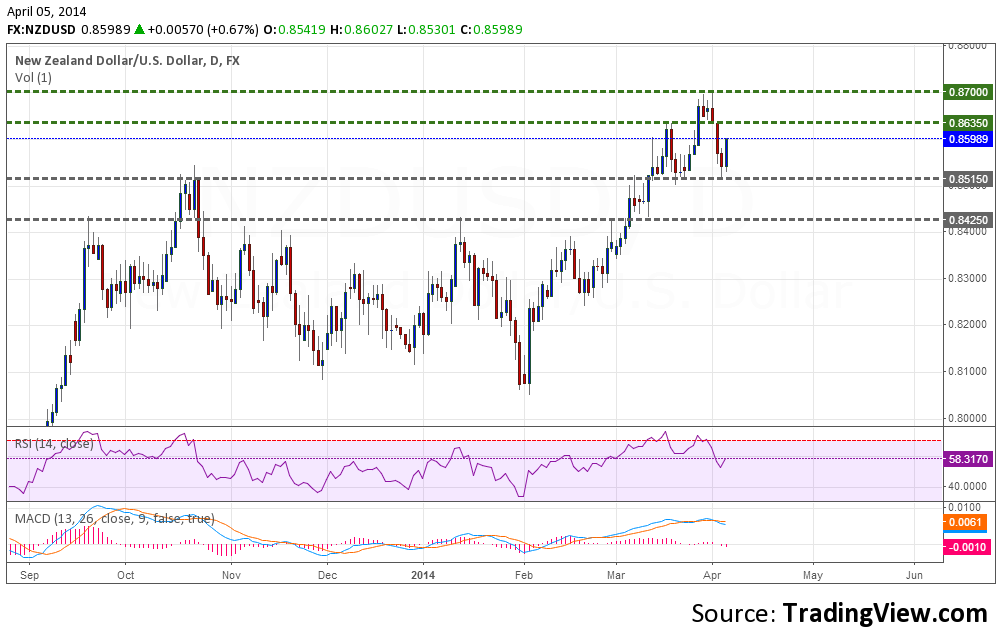
The three bearish signals we were commenting about last week finally got validated by the markets and the price had a downfall touching the first price target of the rising wedge we drew in the previous weekly forecast analysis. Still, the MACD Histogram shows us that the bulls should not be underestimated, while the RSI is on a neutral zone. This week we could see the price trading in the range between the 0.8515 support line and 0.8635 resistance line. Also, at the end of the next week we may see a Head&Shoulders pattern if the high from 0.8700 is not reached.
NZDUSD, H1
Support: 0.8515, 0.8480
Resistance: 0.8635, 0.8700
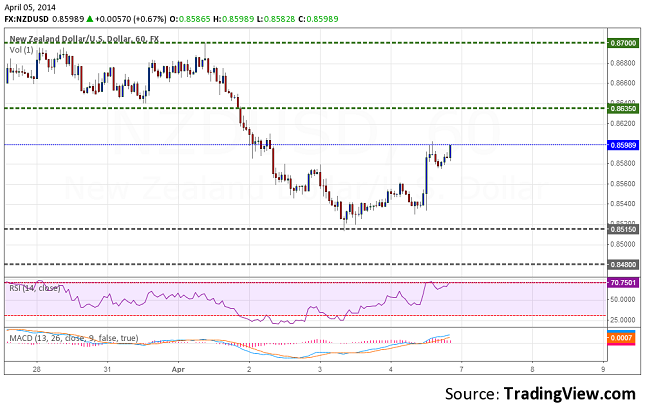
The hourly chart can be better viewed through the MACD Histogram and the RSI as these indicators point towards a potential retracement. The RSI is exactly at the overbought level while the MACD shows how the bulls are taking a break for the moment. So, on this timeframe you should watch for a falling price around the support level from 0.8515.
Bullish or Bearish
For the next week I see an equal battle between bulls and bears, creating a trading range. The party that will prevail, however, it will do at a very narrow margin. So, I expect this coming week to give NZDUSD a more clear direction for the period that will come. Overall, the sentiment is turning from bullish to a moderately bullish and after this week we can see it in the bearish territory.
NZD/USD Forecast For April 7 - 11 by Alin Rauta