Going from the business model to the key growth drivers
If in the first part we took the business model blocks piece by piece and we analyze how these make Netflix click, now it’s time to see the key growth drivers which are behind the company profitability and future prospects. These key growth drivers can be found in Netflix annual report and I am going to analyze them one by one. Also, the source of the financial numbers that I have used throughout this article is Netflix 2013 third quarter financial statements.
1. Investment in Streaming Content
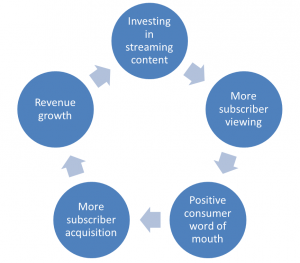
As you can read in their annual report, Netflix rationale behind investing in streaming content is explained in the next virtuous cycle:
In order to differentiate itself from the competition and to gain more market share, Netflix heavily invests in streaming content. Through this strategy, the company aims to keep its customers delighted and to boost both subscribers and revenue growth.
Now let’s see how investing in streaming content really turns into more customer acquisition and revenue growth and how profitable is customer acquisition relative to the revenue growth?
Comparing the results from last year first nine months to this year’s, we can observe that while additions of new streaming content spending increased by 9.54%, total streaming paid members surged by 38% and total streaming revenues saw a 40% advance. So, for every additional dollar invested in new streaming content Netflix brought in 4 subscribers more, which is a very good conversion rate and indicates that Netflix strategy, is showing great results.
2. Continuous Service Improvements
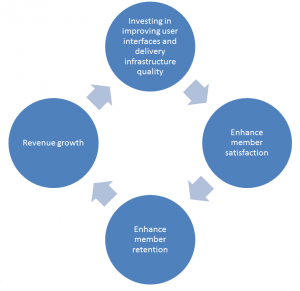
The second key growth driver rationale behind investing in improving online infrastructure is conveyed in the following cycle.
Netflix efforts of improving its service are mainly directed at enhancing member’s retention and the company specifically does it by refining the user experience (i.e. minimizing loading and buffering times).
Now the question is how investing in improving user interfaces and delivery infrastructure quality turns into more customer retention and how profitable is customer retention relative to the revenue growth?
Technology and development spending rose with 14% during the period in discussion. Taking into account the numbers from above, for every additional dollar invested in improving user interfaces and delivery infrastructure, Netflix gains 3 new customers and earns 3 dollars in total streaming revenues. This conversion rate is decent and it gives us an image of how costly is international expansion strategy because Netflix not only invests in improving user interfaces, but also in setting up new online infrastructure outside United States.
3. Overall Adoption and Growth of Internet TV
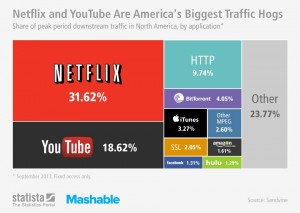
In their annual report, Netflix notice that “domestically, cable and satellite pay TV subscribers numbers have stagnated, while DVR penetration has continued to climb”. This aspect shows that consumers want more control and freedom in choosing what, when, where and how they watch movies or TV series. Moreover, that is exactly what Netflix aims to deliver to its customers. So, this trend could go in its favor, a claim which, for the moment, is backed up by the following statistics.
A new report released by Canadian Internet monitoring firm Sandvine indicates Netflix and YouTube dominate over half of downstream Internet traffic in North America. Downstream traffic refers to data that is received by a computer or network. Namely, this includes receiving e-mail messages, downloading files, or simply visiting web pages. Basically, more than half of the US internet users visit YouTube and Netflix web sites. From this point of view, Netflix sort of crashes its direct competitors; Hulu and Amazon Prime, which have a mere 1.29%, respectively 1.61% of downstream Internet traffic and also tells us that YouTube have great potential to challenge Netflix in the near future.
4. Future of the Consumer Electronic Ecosystem: “Internet on Every Screen”
By making Netflix accessible on a broad spectrum of devices, the company will enhance the value it delivers to the customers and also position itself for a continued growth as Internet delivery of content becomes more popular.
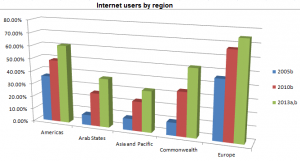
a Estimate. b Per 100 inhabitants. Source: Wikipedia via International Telecommunications Union
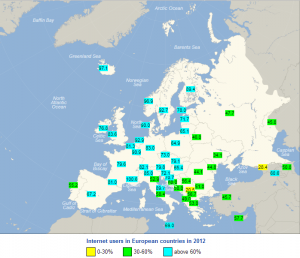
If we take a look at the global trend of internet penetration we can notice a cristal clear continuous growth in internet users numbers by region. Europe is leading the way by having a 76% rate of internet users at this moment. This is good news for Netflix as the company recently made its debut in some countries from Europe (UK, Ireland and Nordic countries) and international paid members more than doubled compared with the same period last year.
Source: Wikipedia via InternetWorldStats
As the above image suggests, Central and West Europe have a major long-term business potential for Netflix as the the internet users rate is above 60%, which is the currently rate in US. So, the company could have a thriving future if they manage to capitalize on this “European business opportunity” and I will this subject on the following paragraph.
5. International Market Expansion
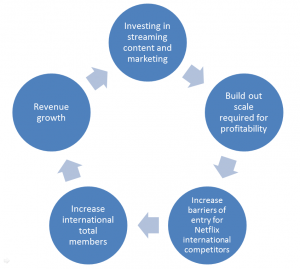
As you can read in their annual report, Netflix rationale behind investing in streaming content and marketing is explained by the next virtuous cycle:
Now let’s take a look at the financial part and ask ourselves how international investment in streaming content and marketing really turns into more international members and revenue growth and how profitable is an increased international market share relative to the revenue growth?
If we are to compare additions of new streaming content and marketing spending to the international streaming paid members and international market share numbers we can infer that for every additional dollar invested in new streaming content, Netflix gained 12 new international subscribers and earned 17 dollars in international streaming revenues. Also, for every additional dollar invested in marketing, the company brought in 29 new international subscribers and gained 41 dollars in international streaming revenues. So, on average for every additional dollar invested in new streaming content and marketing, Netflix acquired 20 new international subscribers and generated 29 dollars in international streaming revenues. These are pretty profitable statistics and signals that international market expansion is the catalyst factor for Netflix future growth.
Also, the international subscribers market share accounts for more and more of Netflix total streaming members. It went from 13% at the end of September 2012 to 21% at the end of September 2013, which is a 58% growth. Hence, Netflix silver lining is international expansion and the potential is still huge and in my opinion this is the key factor which we should pay attention at to gauge the growth of its business.
Comparative analysis
After we analyzed the key growth drivers and how are these translated in numbers and dollars, now I will make a comparative analysis. I decided to compare Netflix with one of the “hottest” internet stocks at the moment rather than with its direct competition because there wouldn’t have been basically no competition, since Netflix is by far the leader of music&video stores industry, aspect proven by the key financial statistics.
For my analysis I chose Amazon (Amazon Prime is a direct competitor for Netflix), Facebook, Twitter (the stock which is in the spotlights right now) and Linked In. The objective is trying to observe whether Netflix is over evaluated and if this is the case which would be the causes?
When talking about earnings per share indicator (serves as an indicator of a company’s profitability), which is the portion of a company’s profit allocated to each outstanding share of common stock, Netflix has the best reading of all five stocks with a value of 1.20$. But, an important aspect of EPS that’s often ignored is the capital that is required to generate the net income. Two companies could generate the same EPS number, but one could do so with less equity (investment) - that company would be more efficient at using its capital to generate income and, all other things being equal would be a “better” company.
This fact leads us to another fundamental indicator which I took into consideration, namely ROE (return on equity), which measures a corporation’s profitability by revealing how much profit a company generates with the money shareholders have invested. From this point of view, Netflix has the second best ROE, behind Facebook’s and at distance in regard to the other three internet companies, making a strong case for a very good profitability rate.
Operating margin is important because it gives us an idea of how much a company makes (before interest and taxes) on each dollar of sales, so the higher the margin, the better. In this regard Facebook emerges again as the leader with a 33.52% margin whether Netflix is ranked third with a 4% rate. So, one of the challenges in the future for Netflix is to reduce the costs.
Price-Earnings Ratio is a valuation ratio of a company’s current share price compared to its per-share earnings and in general and I chose this indicator because it’s usually more useful to compare the P/E ratios of one company to other companies in the same industry or to the market in general. A high P/E suggests that investors are expecting higher earnings growth in the future compared to companies with a lower P/E. Amazon is by far the company from which investors are really expecting higher earnings growth in the future as its PER is 1336.67 and the sheer interpretation is that an investor is willing to pay $1336.67 for $1 of current earnings!!! Netflix is kind of in the “equilibrium” area with a PER of 291.63.
Medium-long term prospects
As a conclusive sentence, I sense that in internet stocks is priced quite a decent amount of future growth expectations, especially Amazon, but overall I think Netflix is one of the least over evaluated internet stocks of the moment. What I meant to say is that future growth expectations are priced as well in Netflix stocks, but not in an exaggerated manner taking into account the potential I have outlined in the first part of the article (key drivers growth).
From a medium-long term perspective (6 to 24 months), I think Netflix has real future growth prospects and this growth I see it in relation with a solid international expansion. So, I reckon Netflix is going to have a bullish path and it will go for the 400$ level until the end of June 2014, consolidating this position by the end of 2014.
Technical analysis and short-term prospects
From a technical perspective, Netflix is currently riding an ascending trend which however shoes signs of weakness and a possible reversal. Decreasing volumes levels is the first factor that should gives us an warning signal, but the most powerful reversal signal comes from a bearish candle sticks formation called Shooting Star which usually announces the end of the ascending trend and the beginning of the decline. This scenario will be confirmed by a closing under the support line from 324$ on a daily timeframe. From there, possible price targets are given by the round level of 300$ and by Fibonacci retracement levels (0.382 and 0.5) at 277$, respectively 242$.
From a short-term perspective (next three months), I reckon Netflix will have a sideways movement with a descending tendency, but I don’t think it will break under the support area until February.
The Netflix Saga, Part 2: Fundamental and Technical Analysis by Alin Rauta

