
Even though there was not any major macro publication from New Zeeland economy and in spite of the positive macro data from the American economy, NZDUSD had a very good week and hit a four month high. This could be explained by the risk appetite law which states that when the US dollar gets stronger, investors raise their risk appetite and start to sell American dollars and buy more risky currencies, like NZD for example. Another reason is the speculation that appeared in the markets which suggests that the central bank would raise the official cash rate next week.
Economic Calendar
Manufacturing Sales q/q (5:45 GTM)-Sunday. This indicator is released quarterly and measures the change in the total value of sales at the manufacturing level. Even though it is a low impact indicator, you should pay attention at it as last time produced a big pleasant surprise with a reading of 4.7%.
REINZ HPI m/m (Tentative)-Monday. It is an important indicator for the real-estate sector which measures the change in the selling price of all homes. This is why it is considered a leading indicator for the housing industry’s health. In the last two months it was published in the negative territory.
[sociallocker]
Official Cash Rate (4:00 GTM)-Wednesday. This indicator has a high impact on markets and measures the interest rate at which banks lend balances at the RBNZ to other banks. An actual value above the forecasted one is good for the NZD. It will be a highly anticipated indicator this week as the markets expect a raise of the rate at 2.75% from 2.5%.
Business NZ Manufacturing Index (5:30 GTM)-Thursday. This is the level of a diffusion index based in surveyed manufacturers. It is derived via a survey of manufacturers which asks respondents to rate the relative level of business conditions. The last two months publications were below expectations.
Technical View
NZDUSD, Daily
Support: 0.8430, 0.8350
Resistance: 0.8540, 0.8670

The daily chart depicts the ascending trend that started at the beginning of February and right now gives a bearish signal as a reversal pattern (rising wedge) has been drawn. The validation of the pattern would come if the price closes on a daily time frame below the support line from the 0.8430 level. If this scenario is to happen, the next price target will be 0.8350. Also, the MACD Histogram tells us that bulls are quite tired and the bears could take control, at least for the start of the week
NZDUSD, H1
Support: 0.8430, 0.8350
Resistance: 0.8520, 0.8560
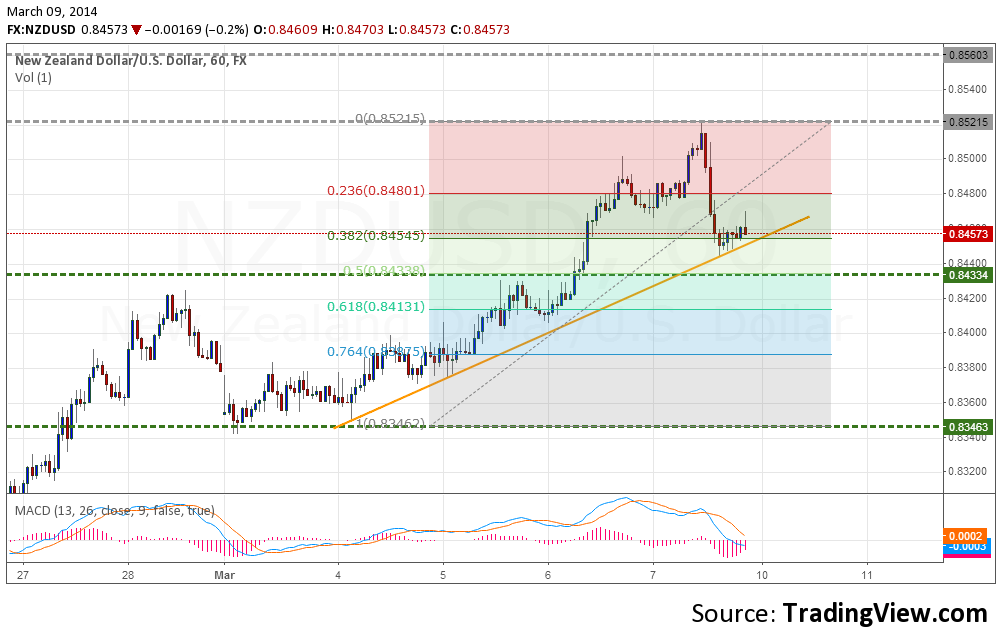
On the short-term time frame, NZDUSD looks like the bulls shrugged off the tiredness period they had Friday and if we take into account the MACD Histogram they are ready for another testing of the resistance line at 0.8520. Nevertheless, if the price cannot test the local highs established last week, NZDUSD seems to have a descending path rather than an ascending one.
Bullish or Bearish
For the moment, the technical part still seems to be on the bulls side and with an expectation of raising the Official Cash Rate this week, the outcome is even bullish. I think the right approach should be a moderately bullish one as a contrarian decision from the RBNZ could easily make NZDUSD to enter in a bearish mood. So, the best line that summarizes this week approach could be:” Expect for the best and prepare for the worst”.
[/sociallocker]
NZD/USD Forecast March 10-14 by Alin Rauta