
We haven’t touched the Bitcoin subject for a while now, this instrument that became of interest for speculators after the incident with Cyprus seems to react something like a safe heaven.
When the markets are undecided or the risk aversion takes its place in trading the Bitcoin is bought.
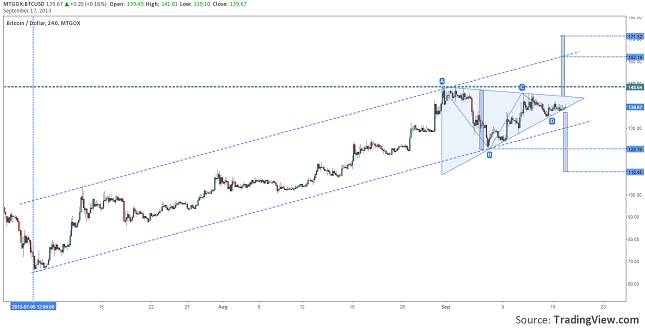
Chart: BTCUSD, H4
From the beginning of July the price for Bitcoin in dollars has moved in a pretty clear up trend. In September the line of the trend was breached and a channel has formed. The price started to consolidate, inside the up channel, in a Symmetrical Triangle with a middle price of 1374 per a Bitcoin.
If the price will fall and close on a 4 hours chart under the lower line of the triangle we can expect for the drop to continue to 130.00, where it will find the trend line, or even lower to 120.00 where it will find the 7th September low (the full target for the downside sits around 110.45$/Bitcoin).
On the other hand a breach above the upper line of the pattern could mean that speculators are willing to buy this digital currency, so the price might break above the 148.64 resistance and rally to 162.20, where it will find the trend line.
The volatility for this currency pair could rise tomorrow during the FOMC meeting and press conference.
Bitcoin (BTCUSD) Consolidated in a Symmetrical Triangle by Razvan Mihai