
Technical analysis has been used for a long time. In the beginning traders were doing there analysis on paper and were only using price action and price patterns to spot opportunities. With the time passing by new ideas evolved, experiments and studies showed that mathematical concepts applied on the price movement could indicate reversals in the price action. This way, the technical indicators were born.
Depending on their applicability and the formula used to create the indicator, we can divide them in two very big categories: trend indicators and oscillators.
The trend indicators are usually used to see the speed of a move, to spot reversals of the trend or they are even used as mobile support and resistance. The Oscillators are indicators that usually move around a specific level or have a limited move between a lower and an upper level. These types of technical indicators are used to see when the market is becoming overbought or oversold. Some of them give very good signals when a divergence is drawn between the oscillator and the price action.
Beside these categories there are some other indicators like Pivot Points, Fibonacci, Pitchfork, etc. These have some special characteristics which give to the trader a better view over the support and resistance of the price action.
Let’s see some examples.
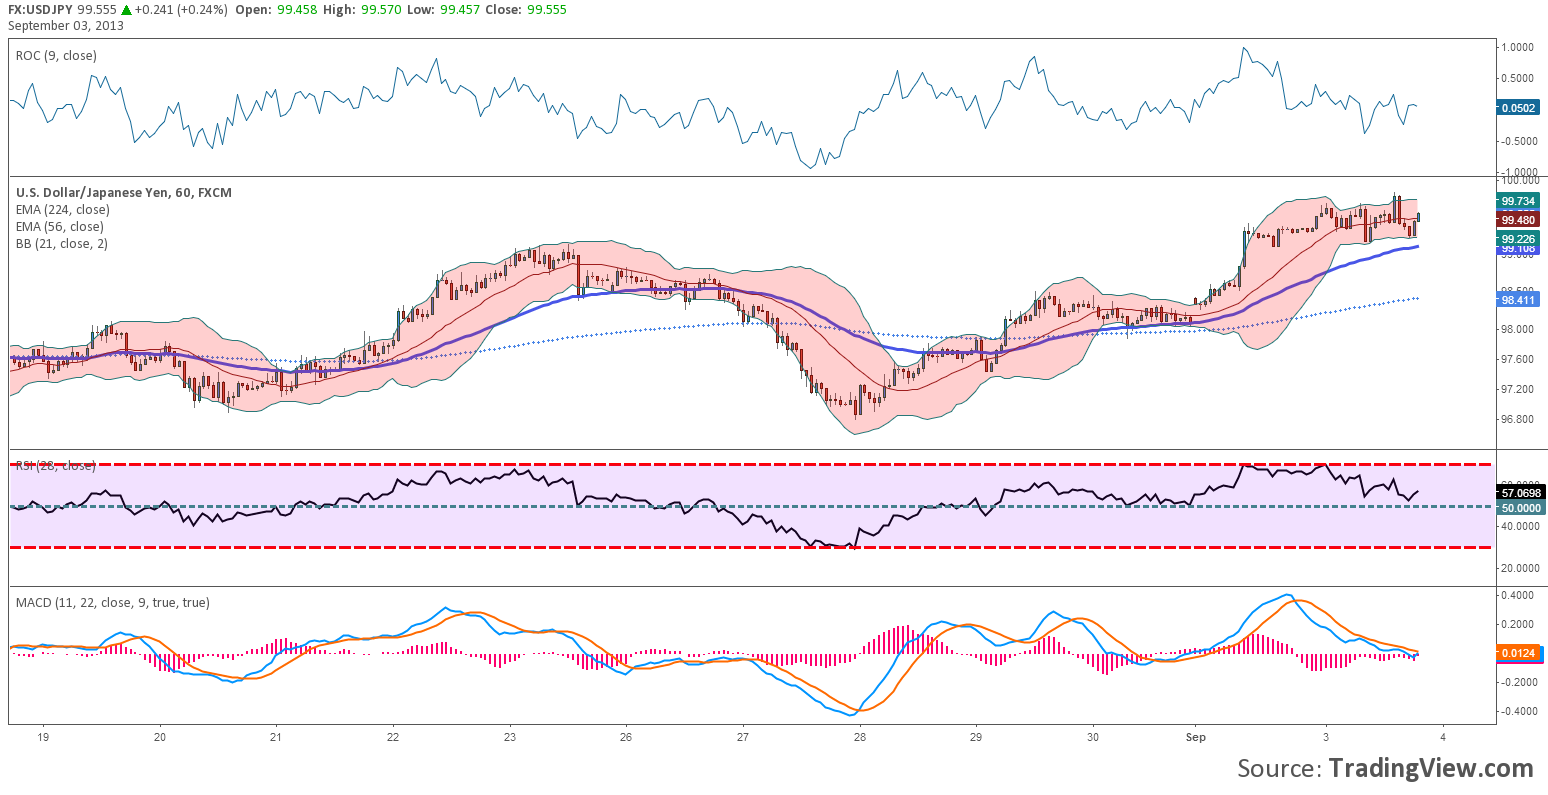
Trend Indicators: Bollinger bands (a range of price volatility); Channel (a pair of parallel trend lines); Ichimoku Kinko Hyo (a moving average-based system that factors in time and the average point between a candle’s high and low); Moving Average (the last n-bars of price divided by “n”—where “n” is the number of bars specified by the length of the average. A moving average can be thought of as a kind of dynamic trend-line); Parabolic SAR (Wilder’s trailing stop based on prices tending to stay within a parabolic curve during a strong trend).
Oscillators: MACD (moving average convergence/divergence); Momentum (the rate of price change); Relative strength index (RSI) (oscillator showing price strength); Relative Vigor Index (RVI) (oscillator measures the conviction of a recent price action and the likelihood that it will continue); Stochastic oscillator (close position within recent trading range).
And the list can go on, because we selected just the well-known examples. Beside the classic indicators there are thousands of other custom indicators made to satisfy the need of the trader. The trend indicators and oscillators are used in trading strategies. They are mostly used in the forex scalping strategies, but they are also found in medium to long term investments methods.
One of the biggest problems that traders have when using technical indicators is that they are using too many in the same time. Each indicator gives a specific trading signal, if a trader overlays more than 4 indicators on his chart; he will have over 4 trading signals. If the signals will not appear in the same time, the trader will become confused and take wrong entry points. Our recommendation is to try to limit the number of indicators at 4 or in exceptional situation 5 indicators.
One other big mistake is to use a bigger number of indicators from the same category. Having 4 trend indicators giving a trading signal at the same time doesn’t raise the probability for the trade to become profitable. Having a number of 4 indicators but of different types giving a signal in the same time the probability for the trade to be a winner will raise.
To be able to trade with one or more indicators, the trader has to know the specifications of the indicator. He must understand how the indicator is calculated, which are the signals gave by the indicator, the trader should do a back testing to learn how to fine tune the indicator to give quality signals.
As a short conclusion we can say that the technical indicators can help anyone create a profitable trading strategy that can be used on different type of markets and different time frames. But for indicators to work, the user should learn as much as possible about them and test them before trading on a real account.
What is the Correct way of Using Technical Indicators? by Razvan Mihai