
It has been a while since we haven’t post something on the major currency pairs, so for today we have prepared a technical analysis on the most frequent traded FX instruments.
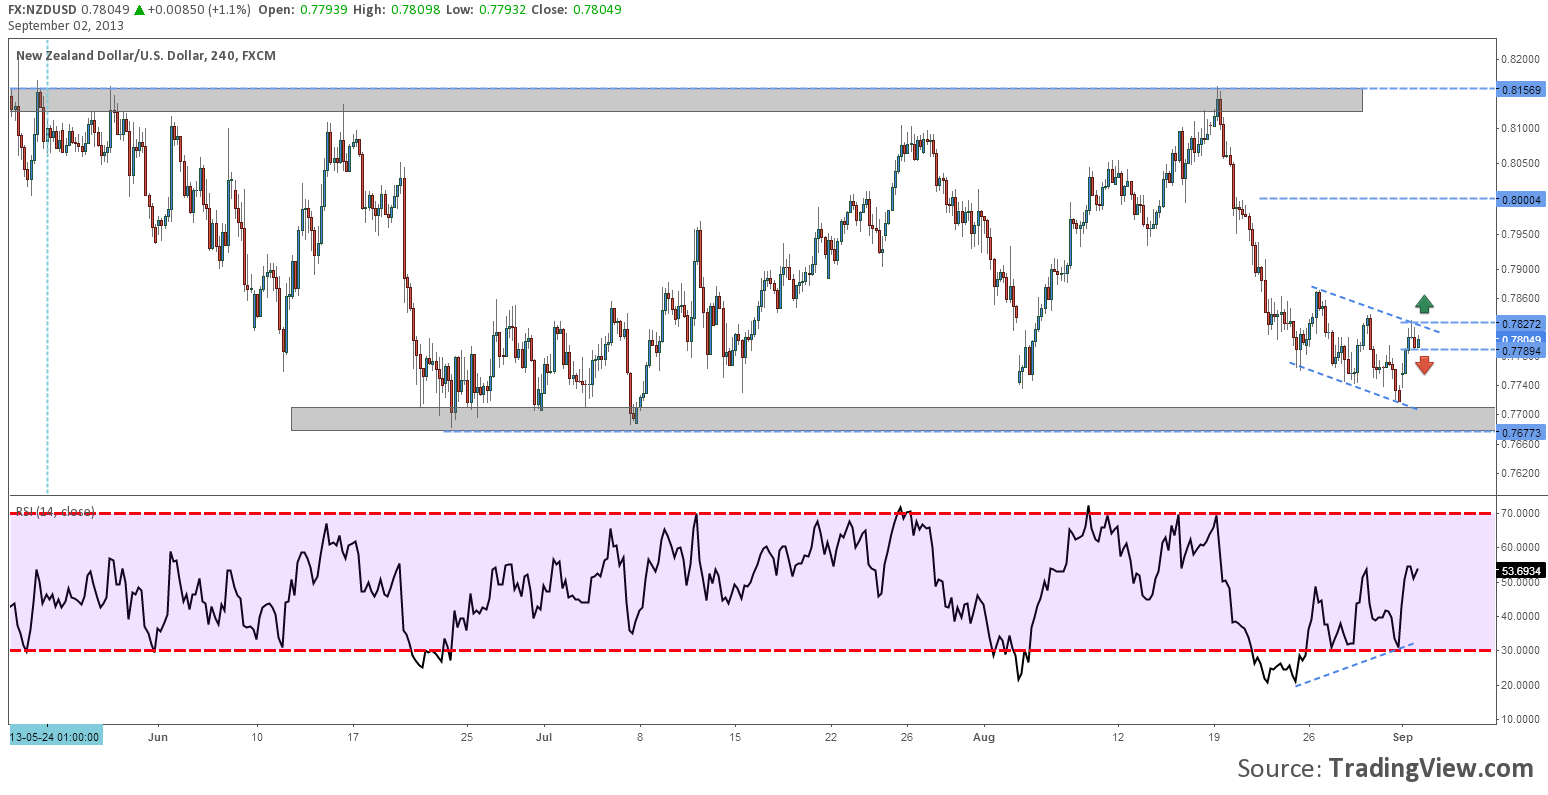
Let us start with NZD/USD, which has moved sideways from 24th of June. Now the price has reached the lower boundary but it started drawing a positive divergence. The price action made lower lows, while the 14 RSI has drawn higher lows, signaling this way a possible reversal. Now it would be better to wait for a confirmation. If the price will fall under the local support, 0.7790, the divergence could have given us a false signal and the down move could continue to 0.7677. On the other hand, a breakout above 0.7872 could trigger a rally that might get the price back to 0.8000.
Chart: NZDUSD, H4
The Canadian dollar continued to lose ground after Canada reported a drop of 0.5% in the GDP. USD/CAD has come back around 1.0600 price level, a high touched in July. The price of this pair seems to be in a grey area between 1.04300 and the current highs. If the resistance will be broken then we expect a rally to 1.0700, while a drop under the support might bring the price back to 1.0300.
Chart: USDCAD, Daily
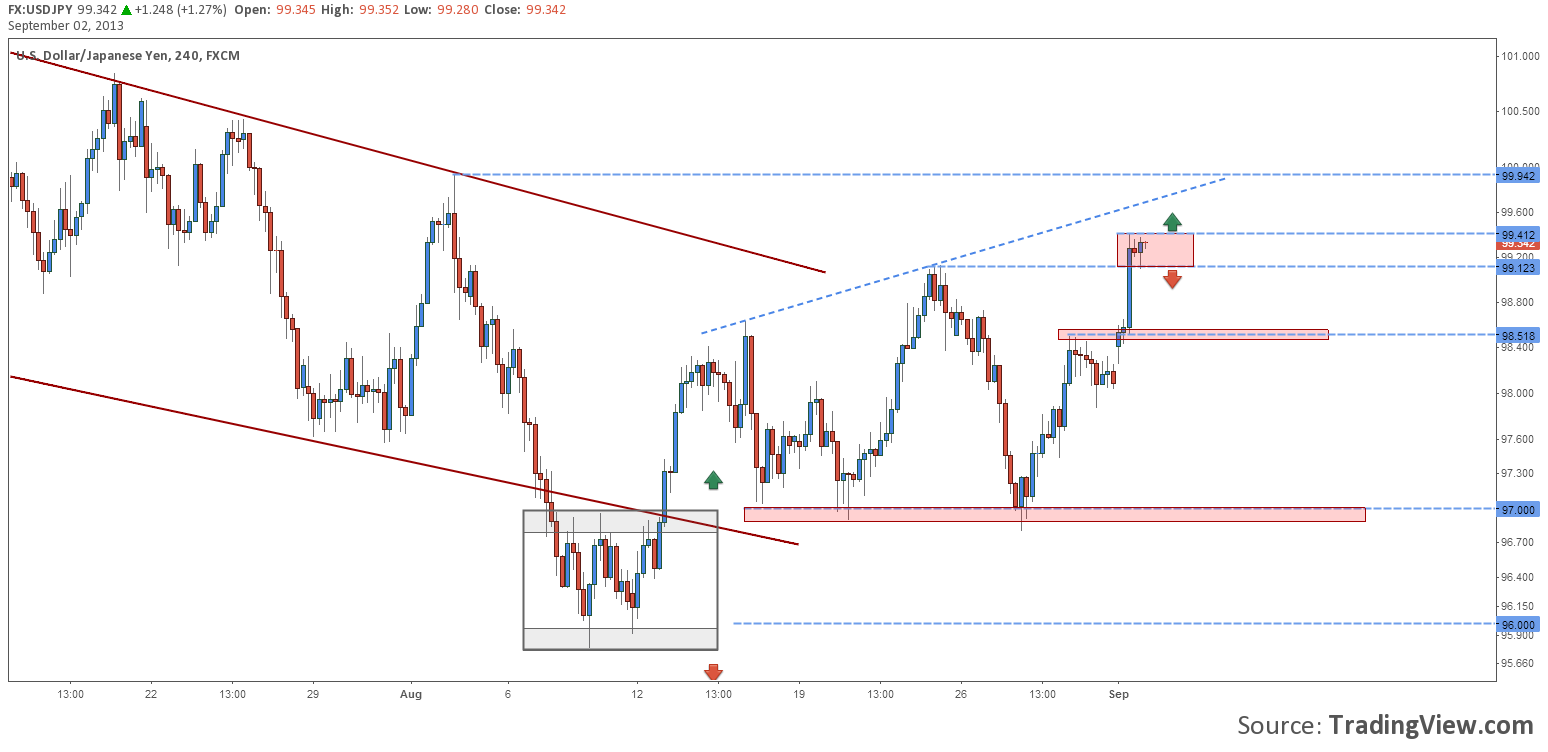
USD/JPY broke up from the Double Bottom pattern and continued to retest 97.00 for several times. In the bigger time frame we can see that the price is consolidating around 98.00 level. On a 4 hours chart we spot a short break of the today’s rally. It is important to wait for a breakout. If the price will break above 99.40, the next good resistance sits at 100.00; on the other hand a drop under 99.15 could be stopped at 98.50.
Chart: USDJPY, H4
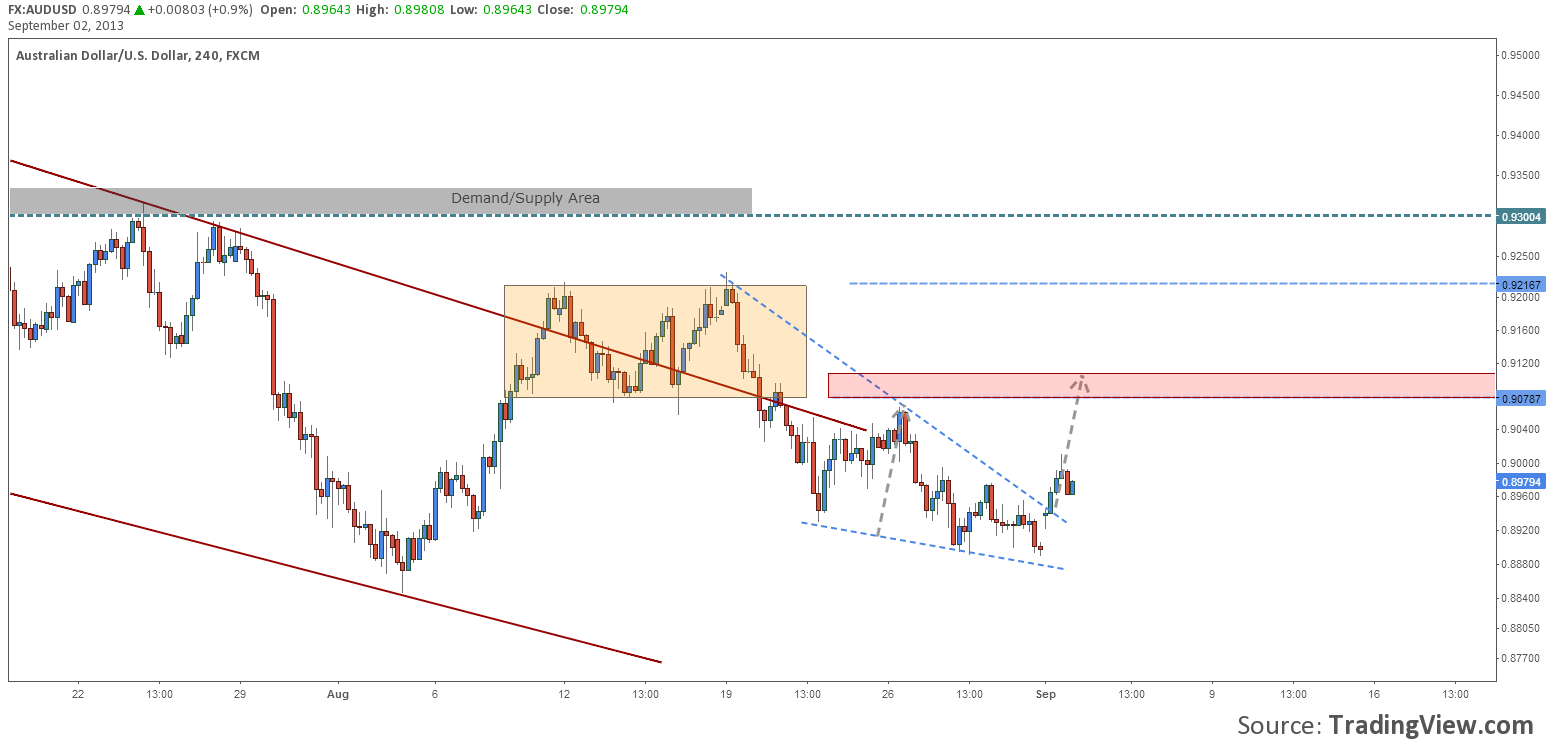
During the past two weeks AUD/USD had a down slope, but the pattern that has emerged is actually a reversal pattern. The Falling Wedge was confirmed by a breakout on the 240 minutes chart (4 hours), but the price of this pattern has not yet reached the pattern’s target. It has found a good support at 0.9000 but a close above this level would leave the road open for a rally to 0.91 where the Wedge’s target is set. If the price will fall under 0.8900 then the higher probability is to continue its fall all the way to 0.8800.
Chart: AUDUSD, H4
We got to GBP/USD. The British pound has managed to stay in an up channel from the beginning of July. It also broke out of a Descending Triangle on 15th of August, but the rise was only sustained until 1.5750. The drop that followed brought the price back to a good demand area right next to 1.54. If the price will close, on a daily time frame, under the support level the pound might get all the way to 1.5000. If the pound’s buyers will drive the price above 1.5600 then the target will become the area between 1.5750 and 1.5800.
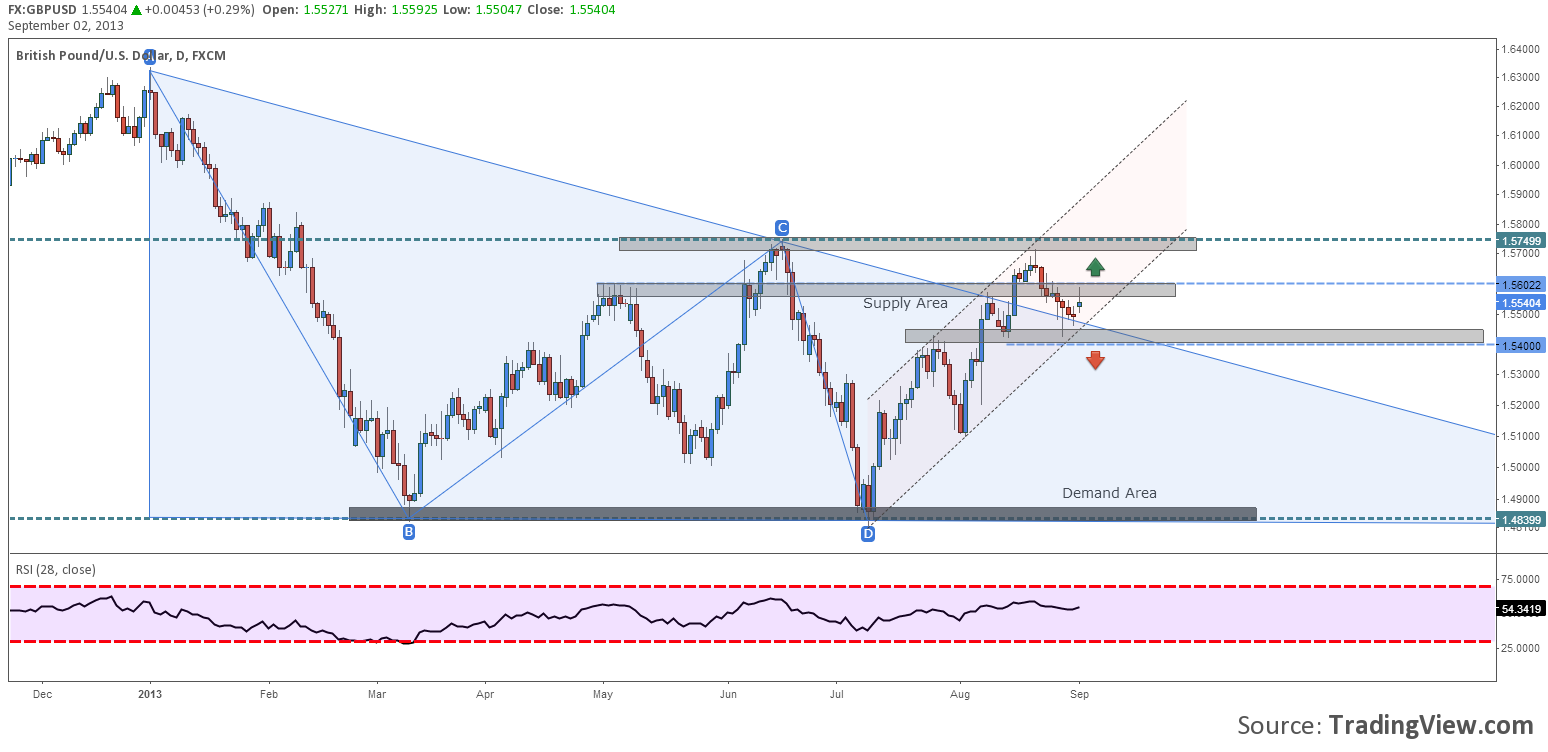
Chart: GBPUSD, Daily
Even though there are some interesting and important technical signals, do not forget to take a look over the fundamentals, and especially over the economic releases and the monetary policy.
Technical Overview on the Forex Majors (2 – 6 September) by Razvan Mihai