
Interval: Daily
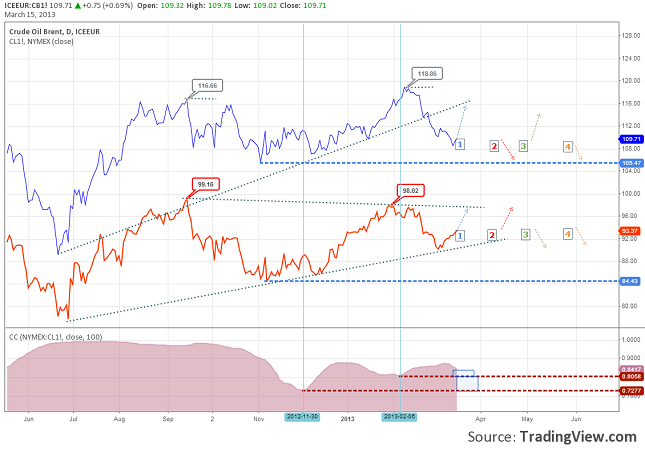
Looking back on the two types of oil chart, we will see that their correlation is very good, hitting a top at 0.9895 on the correlation indicator in the past year. For the moment is getting closer to an older low. This means that their moves are usually in the same direction, but usually one of them signals the reversal first. Now the first to turn its direction was the WTI Crude and it seems that Brent is following.
Let’s make a technical analysis on each price action. For Brent oil we can see that he is in an uptrend, because it made higher highs and higher lows. As long as it will remain over 105.47 dollars per barrel there is a chance for prices to get back to the tops. On the other hand a drop under the level mentioned would be a bearish signal.
WTI Crude is in a symmetrical triangle because we can see lower highs and higher lows in the last evolution. Now it has rejected from the lower line of the triangle and seems to be heading for the upper one. It is pretty hard to forecast where the price will break the triangle because the demand and the supply are equilibrated, at least for the moment.
Getting back to the couple, we can mention other characteristics. If Brent will follow WTI, which now is trying to get to the upper line of the triangle, and pick up the pace, it might retest the broken trend line in the same time, but this would mean that the correlation index should turn upwards. This would be the first scenario, but there could be some more:
- Brent to go down while WTI Crude to continue the rally to the upper line
- Brent to rally back to the trend line while Crude will return to the lower line of the triangle
- Or both will continue the down move and we might see the lows retested.
I think that the first two have a higher probability to come true than the last 2, if we look at the world economy evolution from this period. But never say never, so we should keep in mind the other two as well.
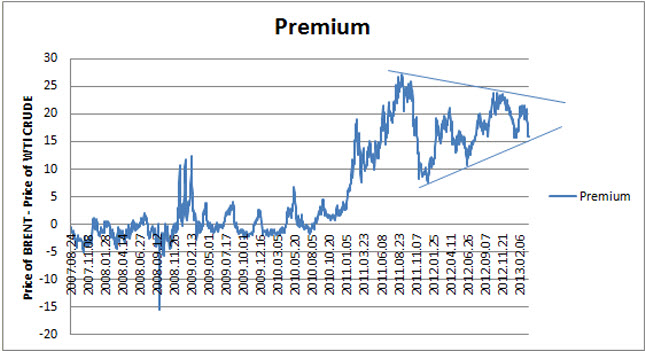
One other characteristic that I have found is an interesting evolution of the premium between the prices. The next chart is showing the evolution of the differences between the price of Brent Oil and the price of the WTI Crude Oil from August 2007 until now. The most interesting part is that in August 2010 it started trending up. After August 2011 it started consolidating in a symmetrical triangle. Now the pressure is on the lower line of the triangle. If it will be broken then we might see a WTI getting closer to the same price of the Brent, meaning that the correlation index could fall under the 0.7277 low. Another rejection from this line means that the consolidation will continue.
As a short conclusion we can say that using both charts for forecasting would improve the result of the analysis and for those who are interested in the medium to long term evolution of this two commodities to pay some attention to the price action at the lines (triangle’s lines or trend lines) and at the support levels especially for Brent.
WTI Crude Oil Leading And Brent Is Following by Razvan Mihai