NYSE: Verizon Communication Inc. Bearish Butterfly

Interval: Daily

verizon-in-bearish-bat-prz-25.03.2013

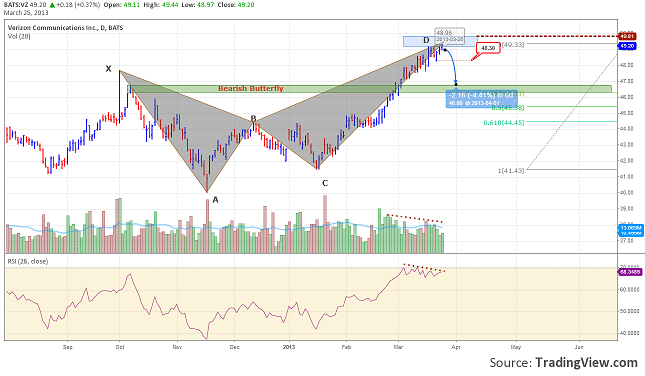
Verizon Communication Inc. is one of the 30 companies that are forming the Dow Jones Industrial Average. In 1983 was born Bell Atlantic which after 17 years of changes acquired former independent phone company GTE and became as it is known today Verizon (NYSE: VZ, NASDAQ:VZ). The company became a provider of communications, information, services to consumers business and governmental agencies. It operates in two primary segments: Verizon Wireless and Wireline.

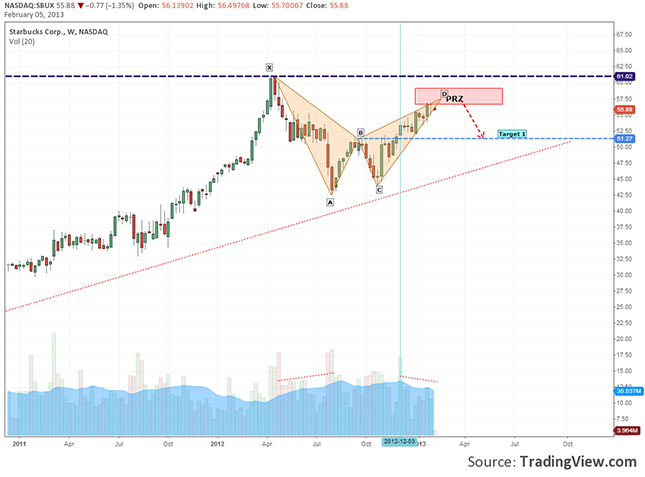
From the beginning of this year the stocks have gained 11%, rallying from $44 per share to the current level of $49. Here it entered in a harmonic pattern PRZ and bearish signals started to appear. The volume dropped on the last run and the 28 periods RSI made a negative divergence right at the 70 level. This throwback could be confirmed by the price action if the price will fall back to 48.30, a slip under this local support might trigger a drop back to 46.80/47.00 zone.

If the price will continue the up move and will have a daily close over 49.81 this setup will be invalidated and the uptrend might continue over 50$ per share.

Garmin Ltd Looks Bad On Trend Line Breakout

Interval: Weekly

garmin-looking-bad-trendline-breakout-20.03.2013

By evaluation standards it seems that Garmin’s shares are still too expensive, even after an impressive price drop. If we take a look at the evolution of Google Maps or the iOS mapping system, we will easily understand that the future is not that bright for Garmin Ltd.

In the future its earnings are expected to shrink. The analysts were hoping for the 2013 EPS to be around $2.83, but now the company is expecting $2.30 to $2.40. The dividend is programmed for 29th of March, at 45 cents per share. It is the fourth quarter with the same dividend for the company.

Its chart doesn’t look good at all. The current low, 33.20, is also the 52 week low and the probability for it to be taken down is quite high. The price has broken the 4 years up trend’s line and a support of a nine month range in one day, accompanied by high volume.

The target for this range breakout is situated at 27.06, 61.8 Fibonacci retrace of the entire trend. In the same zone it can be found the resistance line of a down channel. For the price to get there, a primary condition is the current support level (33.20) to be broken. After that, the nearest support is the 50% retrace at 31.24.

The price action of the latest evolution suggests me that this might be the beginning of a new beautiful down trend.

NYSE: American Express Company After 420% Growth

Interval: Monthly

american-express-420-percent-growth-18.03.2013

American Express Co. (AXP) is one of Berkshire’s “Big Four” public investments. After FED approved the company’s 2013 capital plan, it intends to raise its quarterly dividend by 15%, from 20 cents to 23 cents per share.  The company would like also to buy back a total of $5 billion of common shares until the end of first quarter 2014.

Now let’s take the story to the charts. We can see that from the 2009 low it continually grew. Its price went over 420 percent up in four years. AXP is also one of the Dow Jones Industrial Average (DJIA) companies, but the Dow only rallied 106%.

Their charts resemble a lot, the lows and tops are made almost in the same time. Still American Express trend seems to signal some fatigue, while DJIA makes new record highs. Looking at the Rising Wedge formed on the stock chart and the big divergences on the 56 periods RSI, we might want to think twice if our intentions were of buying.

There is a possibility that the price will consolidate between the last broken resistance and the 127.2 Fibonacci expansion, at 72$ per share. Only a breakout over this latest level will signal a continuation of the trend.

NASDAQ: Bed Bath & Beyond Inverted Head and Shoulders

Interval: Weekly

bbby-inverted-h&s-confirmed-13.03.2013

Bed Bath & Beyond Inc. (BBBY) is a chain of retail store and they are selling  usually domestic merchandise. The chain includes 1,173 stores in 50 states, some of them are Puerto Rico and Canada.

The company is occupying now #251 spot in S&P500, after taking McGraw-Hill Cos.’s place. It’s market cap is now 13.43 billion dollars. From a Reuters analysis it seems that BBBY shares have the potential to rise as much as 25 percent over the next year. This growth would mainly be based on strong profits. If world economy will start to pick up speed, especially in USA then this up move is pretty credible. And it is likely to attract the interest of some private investors, or even Berkshire Hathaway Inc,  which will buy premium shares,

Looking on the price action evolution we can see that it has touched the uptrend’s line, after falling 22.6% from its latest high, touched in June last year. At the trend line the price has formed an Inverted Head and Shoulders, one of the most used reversal pattern. The price pattern was not only drawn, but also confirmed by a Breakaway Gap which got the price over the formation’s base, but also over the 60$ key resistance.

The targets for the up move are 65$ (the Inverted H&S target), 67.50$ the next resistance, 71.60 and 75.85 (the last top but would also mean a 25% growth from the current price).

NYSE: Heinz Trade Setup After 20% Jump

Interval: Daily

heinz-trade-setup-07.03.2013

Last year Heinz had realized a good profit after the sales went up to $11.6 billion. Now they are looking overseas for growth and are betting on the emerging markets, expecting a quarter of the company’s sales this year to account on them.

Their results attracted Warren Buffet and its partner on the deal (3G Capital, the investment firm that bought Burger King in 2010) to invest $23.3 buying Heinz. This news has sent the price of the shares from $60.5 up to $72.5 at the opening of 14th of February. Meaning  a 20% growth in an extremely short period of time.

From the technical point of view, we can see the up channel with a moderate degree, and after that a 12 dollars gap which have sent not only the price in the clouds but also the ROC (Rate of Change) and the 28 period RSI in the mega overbought zone.  Even though it has been a good news for the investors, the up move can’t be sustained for a long time now on without a correction.

This setup is triggered if the price will fall back under 71.80. The Stop loss would be set over the latest tops at 73.20 and the Target at the 66.70 level, meaning a 50% fill of the gap. The risk/reward ratio it is pretty good, 3.45.

NASDAQ: SBUX Harmonic Bearish Bat Pattern

Interval: Daiiy

starbucks-bearish-bat-harmonic-pattern-05.02.2013

The Starbucks stock displays on the chart a harmonic pattern in the form of a Bearish Bat.
Coming from PRZ there is a chance a rejection could take place and go back to 51.27. On 20 timeframes the average volume is going down for the move on the up direction to get the price in a place for reversal. A possible closing in the zone marked on the chart makes the Bearish Bat null and triggers a call for the continuation of the trend.