DAX Future Evolution Based On German Economic Data

dax-evolution-on-economic-data-13.03.2013
In mid-February the leading indicators (ZEW Economic Sentiment, Flash Manufacturing PMI and Ifo Business Climate) came in a positive direction, especially ZEW and IFO which have exceeded the expectations. In this situation we would have expected some good economic data releases for the next period.

Well it wasn’t quite like that, because the economic data posted for Germany was pretty low. After a final q/q GDP of -0.6%, as expected and final CPI m/m of 0.6%, as expected, only the retail sales came over the market estimates at a value of 3.1%. The rest of the macroeconomic indicators were lower than forecasts:

Indicator Actual Forecast Previous
Unemployment change -3k -5k -14k
Industrial Production 0.0% 0.6% 0.6%
Factory Orders -1.9% 0.6% 1.1%
WPI m/m 0.1% 0.4% 0.3%
Trade Balance 15.7B 17.9B 16.9B

This number cannot be a good signal for the future evolution of the economy. Next week will be published again the flash PMIs, ZEW and IFO Business Climate and it will be interesting to see the releases.

Another interesting point of view is related to the evolution of the 10 years bond, or known as German Bunds. At the last bond auction the yields were up 9 points at 1.66, meaning that the investors were interested more in risk assets, and the demand for the demand dropped for this fixed income instruments. If this will change next week and the yields will drop then we might see a risk aversion that will drag Germans shares lower.

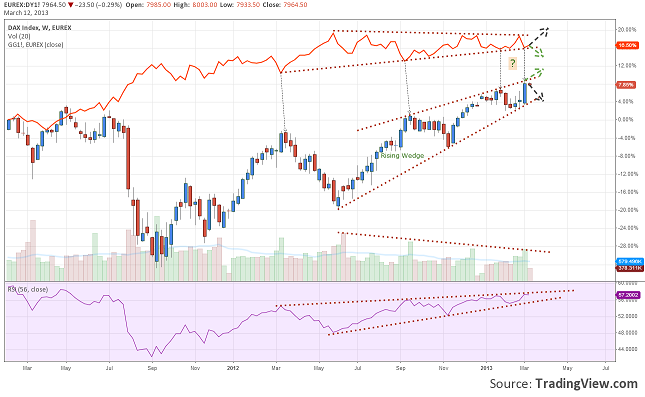
If we will take a look over the charts of DAX (German index) and Bund on a Weekly time frame, we will observe, that on the latest evolution, when an important low was drawn on the Bunds chart, an high was drawn on the DAX.

The signals at this moment are not bullish at all. On the main chart (stock average) the price has made a rising wedge and the same on the 56 RSI. Volume dropped during the uptrend. On the bonds chart the price moved in a symmetrical triangle consolidation.

Keeping in mind all the things mentioned earlier we can look for a signal from the evolution of the bunds to understand what might happen to the DAX. If the price will go up, making a new low or breaking the upper line of the triangle, then the investors might try to get back in safer assets and this might trigger falls on the stock exchange.  On the other hand if the price will break the down line of the triangle then we might see an invalidated Rising Wedge, because the DAX will keep on rallying.

Dollar Index Heading for a Bearish PRZ

Interval: Daily

dollar-index-bearish-prz-06.03.2013

Looking at a daily chart, we can see a straight up move that started at the end of January. The price went through the 81.42 key level and after that retested it. Now it is on an open road to a Bearish Bat PRZ that is situated between 83.00 and 83.48.

This up move that is in place right now it is sustained also by the economic data that came from the United States. Yesterday the ISM Non-Manufacturing PMI was published at 56.0, over the estimates of 55.0. Today the ADP (number of jobs added in the private sector) was well over the estimates at 198k, and the Factory Orders are down at -2%, better than -2.2% expected.

If tomorrow the Trade Balance and the Unemployment Claims indicators will come on positive grounds, then we might see the price going straight to the D point zone, meaning inside the Potential Reversal Zone of the harmonic pattern. From there it is a matter of price action confirmation. The RSI is really close to its overbought zone, and a price pattern formation or a candlestick pattern would confirm a reversal.

Don’t forget to keep an eye on the website for new posts and updates, and also for the Weekly Fundamental Wrap Up during the weekend.

DJI: DOW Jones Industrial Broadening Formation

Interval: Daily

dow-jones-boadening-fomation-04.03.2013
The Americans got back their optimism in the past weeks, we can see this in the uptrend on the Dow Jones Industrial, one of the most important indexes from United States. This growth is also sustained by the economic data from USA, for example we can take the ISM Manufacturing PMI which was published for the third month over expectations and in the positive territory.

Getting back to the chart we will observe a price pattern formation called Broadening Formation (known also as Megaphone Top). If this, in the past was a reversal pattern, nowadays it is considered as a congestion area which might signal a continuation of the trend, not only a reversal.

If the price will break over the latest top at 14148 (preferably closing over it also, to avoid a false breakout) then the target will be 14460, just over the 161.8 expansion of the last important correction. On the other hand, if the price will fall back to the lower part of the pattern, we should wait for a down break to target 13600 and 13400.

Price action is everything when using price patterns, don’t forget to look for confirmations and also keep an eye on the site for updates on DJI.