Forex Analysis

Forex also known as the foreign exchange market refers to the trade of global currencies, and is one the most liquid exchanges in the world with volumes reaching almost 5 trillion dollars.
The trades are made on currency pairs, some of the most popular are: EUR/USD, USD/JPY, GPB/USD and USD/CHF, these are considered the majors.
Our Forex analysis are done with the help of advanced chart technical analysis combined with daily fundamental news analysis of macroeconomic indications and political situations, considering also market sentiment.

FX: EURJPY Rising Wedge, Might be the Expected Correction

What a day! By far, the event of the day was the ECB monetary policy and press conference. During Draghi’s speech and while he was answering the questions of the journalists, the EURUSD has moved in both directions. After the end of the event Euro started appreciating and the currency pair was heading for 1.32 hitting the target price for our yesterday’s setup Trade Setup EURUSD on Consolidation Breakout.

After a short break from the market, we were surprised to see that EURUSD touched 1.33 and didn’t understand why. The answer came pretty fast from EURJPY. It seems that it was not the Euro that was appreciating, the dollar was losing ground. The yen has gained in the last few hours, meaning that there is some risk aversion in the market and this theory was also sustained by other fundamental news and commentaries.

eurjpy-rising-wedge-06.06.2013

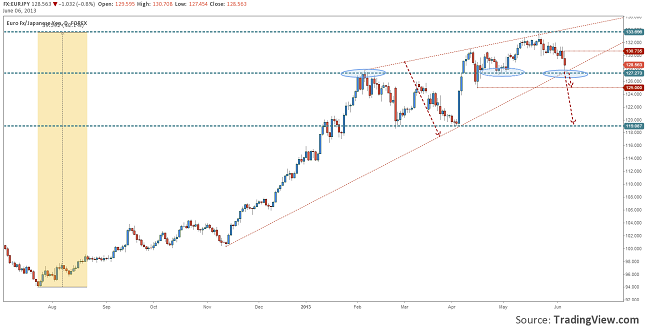
Chart: EURJPY, Daily

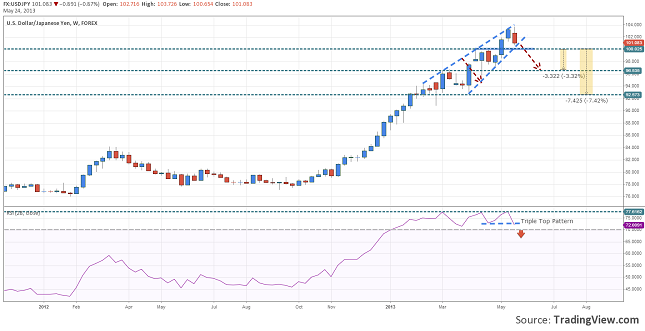
Let us get back to the EURJPY chart. If you remember our analysis on USDJPY (FX: USDJPY Made a Rising Wedge Pattern, by the way the target we gave for that analysis was hit today) we were talking about a specific pattern Rising Wedge, which we also found on Euro with the Japanese yen

In 11 months the Euro has gained 40%. The trend is giving now some bearish signals. The last corrective move has stopped at a pretty important zone of the uptrend. First there is the 127.30 support and after that the trend line. If the price will fall and close, on a daily basis, under this cluster then we can say that the pattern is confirmed. The first target for the fall would be 125.00.

On the other hand a loss of the yen could bring the quotation back to 130.75.

EURSEK Ascending Triangle Waiting to be Confirmed

For today we have chosen an exotic currency pair because its charts look pretty interesting. The Euro has lost 30% in the past 4 year in front of the Swedish krona and now is trying to recover.

eursek-ascending-triangle-04.06.2013

Chart: EURSEK, Daily

The Swedish currency acted as a safe haven for the investors because the country’s economy was stable throughout the financial crisis. With each positive signal coming from the Euro Area the single currency gains trust and try to come back from the dip.

On a daily chart we can see that the price has consolidated in an Ascending Triangle pattern with the upper line on the 8.6476 level. This price pattern was created right after the down trend line was broken. If it will be confirmed by a close over the resistance then we can expect for it to rally at 8.80 where it will hit the target and also another important resistance and the best part is yet to come. A break through this resistance would confirm a Double Bottom pattern, but we will come back to it when it will be the case.

On the other hand if the risk aversion will be reinstalled we might witness a drop under the lower line of the triangle and most probable a test on the 8.49 support level.

FX: USDJPY Made a Rising Wedge Pattern

On our last week Wrap Up 13-17 May USDJPY Up 1.32% we right about a Rising Wedge pattern that it is drawn on USDJPY. Well it needed two more days before the party started and the Japanese yen appreciated as a safe haven asset.

usdjpy-risiging-wedge-with-7.4-drop-24.05.2013

Chart: USDJPY, Weekly

The price of this currency pair dropped suddenly after Bernake testified in front of the Economic Committee and the next morning the fall continued because of the risk aversion triggered by a very low Manufacturing PMI from China.

At the end of the week USDJPY seem to be at the lower line of the reversing pattern. It has right under it very good support zone formed by the lower line of the wedge and from an ex-resistance and round number, 100.00. If it will break this area and have a daily close under it then we can think of a bigger corrective move for the rising trend.

The targets for this pattern are at 96.53, if we are projecting its width and at 92.53 if we take into consideration its base line. The fall might be of 3.3% or of 7.4%.