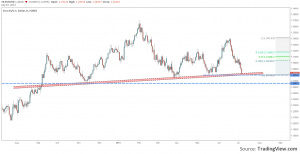
How Did The EURUSD Dropp 1.48% Last Week? May 30, 2022 investazor Leave a Comment on How Did The EURUSD Dropp 1.48% Last Week? A really important week has passed for the EURUSD currency pair. As we know, in the first week of the month the ECB has the monetary statement and the press conference and the Non-Farm Payrolls is published for the United States. At this press conference Mario Draghi pointed some things regarding the positioning of the ECB in what concerns the economy of the Euro Zone: Euro Area growth risks remain on the downside Inflation risks are broadly balanced, inflation rates may be volatile throughout the year Economy should recover at subdued pace 0.50% interest rate was maintained, but it is not the lower bound The rates to stay low for extended period of time ECB keeps an open mind on negative deposit rates If this wasn’t enough, S&P lowered Portugal’s outlook to negative from stable. The country’s current grade is BB and rating company sees one in three chance of ratings cut within the next 12 months, and the also see a deficit about 5.8% of the GDP for 2013. For the United States the story is a bit different. Several weeks ago Ben Bernanke said that the Federal Reserve is preparing for tapering the Quantitative Easing Program by the end of 2013, and stop it in 2014. The conditions for these measures were that the economy to head towards their forecast and the unemployment rate to drop to or under 7%. One day after the ECB’s press conference, the Non-Farm Payrolls was published. It surprised the market with a value of 195K vs. 165K expected, and the previous value revised to 195K. Even though the Unemployment Rate did not come as expected and stagnated at 7.6%, the biggest impact came from the NFP. Chart: EURUSD, Daily This week Euro dropped almost 1.5%. The biggest fall took place on Thursday and Friday. The speech of Mario Draghi did not encourage the investors to buy euros and the dollar continued its trend. Next day, the economic data showed an improvement in the US labor market, the dollar continued to appreciate. From the technical point of view EURUSD got to a good support area, formed by 1.28 level and a trend line. The probability for the down trend to continue it is quite high. If this area will fall the next good support it is at 1.2650. Before a breakout we could see a bounce back to 1.29 or somewhere near 1.30.
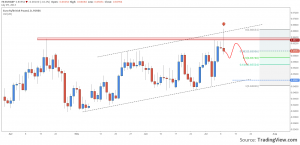
FX: EURGBP Bearish Signal Out Of Nowhere May 30, 2022 investazor Leave a Comment on FX: EURGBP Bearish Signal Out Of Nowhere Today the Great Britain Manufacturing Production fell unexpectedly -0.8%, while the expectations were of 0.3% growth. The industrial production stagnated and the Trade Balance was in line with the forecasts. Chart: EURGBP, Daily These release had a negative impact over the evolution of the GBP. GBPUSD dropped under its latest low and EURGBP touched a high at 0.8668. The most interesting evolution of the day came after the downgrade of Italy. Euro lost almost everything it had gained and EURGBP fell back under 0.8600. If this day will close around 0.8595 we can say that the break above the 0.8630 resistance was a false one and a Shooting Star pattern will be confirmed. We are expecting for the price to continue the fall, during the next days, back to 61.8 Fibonacci retrace (0.8550) of the preceding move. The setup will be invalidated only by a close above the current high.
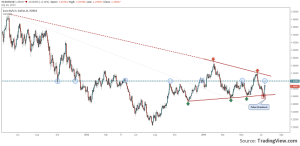
EURUSD Was Not Yet Ready For… May 30, 2022 investazor Leave a Comment on EURUSD Was Not Yet Ready For… In the first week of June, Mario Draghi said that ECB will keep the interest rates at record low for an extended period of time and there are arguments for it to be cut even more. In the same week, on Friday the Non-Farm Payrolls surprised the market with a value above all forecasts. The dollar got stronger and stronger, managing to get the EURUSD quotation under 1.2800. The story does not end here. Last week, the second week of the month, were published the FOMC Meeting Minutes and Ben Bernanke had a speech titled “A Century of US Central Banking: Goals, Frameworks, and Accountability”. Investors were disappointed to see that, in the minutes, there was no date from which Fed will start tapering the monetary easing program. The full attention was moved to Ben’s speech, but nothing was said about any dates. This time the dollar started to lose and in several hours EURUSD got back over 300 pips. Next week Ben Bernanke will testify on the Semiannual Monetary Policy Report before the House Financial Services Committee, in Washington DC Chart: EURUSD, Daily Looking at the price action of EURUSD we can say that it wasn’t ready to break out from the consolidation pattern, which is actually a symmetrical triangle. The lower boundary is around 1.28 level while the upper one sits at 1.34. The main axis, as it can be seen on the chart, is 1.3200. This level seems to be the equilibrium one. If the price breaks above 1.32 we can expect for it to test the upper line of the triangle, while if it drops or remains under the pressure rises on the lower line of the pattern. This currency pair will remain sensible to the economic data published from the United States and will the volatility will increase during the speeches of Mario Draghi and Ben Bernanke.
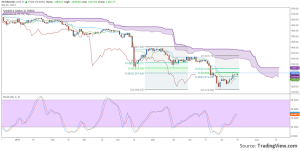
Gold (XAUUSD) Might Bottom Around Current Levels May 30, 2022 investazor Leave a Comment on Gold (XAUUSD) Might Bottom Around Current Levels After hitting a low under 1180$ per ounce the price of Gold bounced back to 1290$ per ounce. The most interesting thing about this throwback is that the commercials are still net short on this instrument, but the open interest is on the up move. This might mean that the precious metal is being bought by private investors more, and less by Central Banks and Hedge Funds. Chart: XAUUSD, Daily Tomorrow Ben Bernanke is expected to have another speech. Investors will look for signals regarding the Quantitative Easing. If the Fed will start tapering it later than September, we might see another rally in the price of gold, while if this date will be maintained there is a possibility for the price to drop suddenly. Looking at the technical analysis of gold’s price chart using a system based on Ichimoku Kinko Hyo, we observed that the price is now in the layer between the Tenkan-sen and Kijun-sen averages. Adding a Fibonacci retrace we can conclude that 1300$ per ounce is a very good resistance level. If the price will break and close above this level we can expect for it to rally to 1350$ per ounce, where it will find itself in the Kumo. Even though the signals are bullish, keep an eye on the 1270$ support. A break under this level could mean another drop for the price of gold. The target levels for a down move are 1210$ and 1180$ per ounce.
USD Or JPY What Would Traders Choose? May 30, 2022 investazor Leave a Comment on USD Or JPY What Would Traders Choose? From the top of this year, hit in May, the US dollar lost about 9.5%. It managed to recover about 78% of this fall after Federal Reserve announced that it will start tapering the QE program this year and stop it in 2014. Chart: USDJPY, H4 Yen is becoming a week currency because of the monetary easing started by BoJ. The program already shows an improvement in Japan’s economy so the Central Bank will maintain it a current values until the end of the year. They are targeting deflation and the devaluation of the currency, in their opinion, is just the effect. During the past 7 days USDJPY has consolidated in a symmetrical triangle right under the 78.6 retrace of the latest impulse of the main uptrend. This means that investors are not yet convinced in which currency to invest. While they are waiting for further signals from the Central Banks, we can look for technical signals to understand in which they will invest next. If the price will break the upper line and close on a 240 minutes time frame above it could trigger a new rally for the US dollar and target the 102.00 price. On the other hand, if the price will close under the lower line we might witness a drop to 96.70 (the 61.8 Fibonacci retrace of the uptrend).
Advanced Forex Scalping Bollinger Strategy May 30, 2022 investazor Leave a Comment on Advanced Forex Scalping Bollinger Strategy This scalping system uses two types of Bollinger Bands and an Exponential Moving Average. It can be used on any currency pair and the time frame could be set from 1 minute to 15 minutes, but it seems to be working best on the 5 minutes chart. Bollinger Bands is a technical indicator discovered by John Bollinger., its default settings are a moving average of 20 periods and a standard deviation of 2. This system uses one Bollinger Bands with a moving average of 21 and a standard deviation of 2 and one Bollinger Bands with the same moving average but with a standard deviation of 3. The idea of the system is to look for the moments when the price touches the upper or the lower layer between the standard deviation of 2 and standard deviation of 3. Using 200 EMA will help the trader follow the important trend. If the price it is above the EMA the trader will look only for long entries. If the price is under the EMA then the trader will look for short positions. The signal would be a candle which touches (or better closes) inside the layer between the two deviations and the confirmation would be a candle of the opposite color signaling the reversal. If the conditions are fulfilled a trade should be opened on the opening of the third candle. The Stop Loss should be set under/above the previous two candles, on the low/high (depending if the price is under or above the 200 EMA). The first target can be set at the 21 moving average of the Bollinger Bands and the second target could be set on the upper/lower line of the Bollinger Bands with a standard deviation of 2. Look over the example bellow for better understanding. The same system can be applied also if the price is under the 200 EMA.
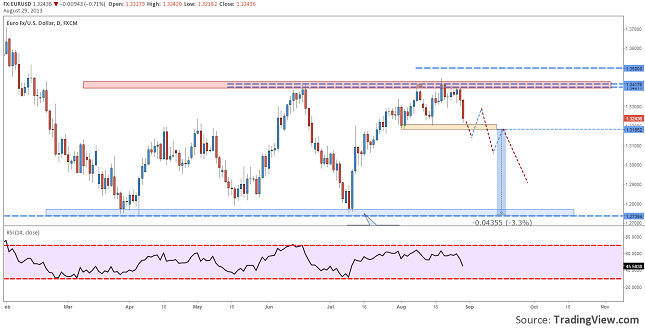
EURUSD Daily Technical Perspective After GDP Release May 30, 2022 investazor Leave a Comment on EURUSD Daily Technical Perspective After GDP Release Last week the Euro has reached a top at 1.3450, but it did not remain to long there because the US dollar started to recover. This week started with a consolidation around 1.3400. When the problems in Syria started and the US rushed with their affirmations to blame the Assad government the risk aversion was established among investors. If a war is to be occurred the safe heavens would start to appreciate and also the price of oil to rally. This time it took only some press declaration for the safe heavens to start appreciation. The Japanese yen reached monthly highs and also the US dollar started to gain in front of his counterparts. Today the conflict in Syria came second after the release of the United States GDP. It was expected an economic growth of 2.2%, but the official number was actually a 2.5% rise. Chart: EURUSD, Daily The publication of the GDP triggered new buys for the US dollar so the EURUSD drop under 1.3250 support and reached 1.3200. Here, Euro has found some buyers, but the drop might not be finished yet. We are expecting a short drop under 1.3180 before another correction, as you can see on the chart. There is a possibility for the buyers to hold on at 1.32, if this would be the case, then we could expect a rally back to 1.3400.
What To Expect For The First Week Of September On The Forex Market? May 30, 2022 investazor Leave a Comment on What To Expect For The First Week Of September On The Forex Market? The last week of august should have past smoothly, because there were no expected very important events. Still the conflict in Syria has raised the volatility of the markets. Overall the stock market has fallen, the price of oil rallied and touched a new high for the past six months and on the Forex Market safe heavens appreciated the most. On Thursday the spirits calmed down regarding Syria, but the release of the US GDP above expectations (2.5% vs. 2.2% exp.) has triggered another rally for the US dollar. The first week of September it is expected to bring high volatility especially on the FX market because of the economic releases. Date Currency Forecast Previous SunSep 1 CNY Manufacturing PMI 50.6 50.3 MonSep 2 NZD Overseas Trade Index q/q 3.90% 4.10% AUD AIG Manufacturing Index 42 JPY Capital Spending q/y -2.00% -3.90% AUD MI Inflation Gauge m/m 0.50% AUD Building Approvals m/m 4.10% -6.90% AUD Company Operating Profits q/q 1.10% 3.00% CNY HSBC Final Manufacturing PMI 50.2 50.1 AUD Commodity Prices y/y -11.80% EUR Spanish Manufacturing PMI 50.1 49.8 CHF SVME PMI 55.9 57.4 EUR Italian Manufacturing PMI 50.7 50.4 EUR Final Manufacturing PMI 51.3 51.3 GBP Manufacturing PMI 55.2 54.6 CAD Bank Holiday USD Bank Holiday TueSep 3 GBP BRC Retail Sales Monitor y/y 2.20% JPY Monetary Base y/y 41.30% 38.00% CNY Non-Manufacturing PMI 54.1 NZD ANZ Commodity Prices m/m 0.60% AUD Retail Sales m/m 0.40% 0.00% AUD Current Account -8.3B -8.5B JPY Average Cash Earnings y/y 0.80% 0.60% JPY 10-y Bond Auction 0.80|3.5 AUD Cash Rate 2.50% 2.50% AUD RBA Rate Statement CHF GDP q/q 0.30% 0.60% EUR Spanish Unemployment Change -5.2K -64.9K GBP Construction PMI 58.4 57 EUR PPI m/m 0.20% 0.00% USD Final Manufacturing PMI 53.9 53.9 USD ISM Manufacturing PMI 54.2 55.4 USD Construction Spending m/m 0.30% -0.60% USD IBD/TIPP Economic Optimism 46.2 45.1 USD ISM Manufacturing Prices 51.6 49 WedSep 4 GBP BRC Shop Price Index y/y -0.50% AUD AIG Services Index 39.4 AUD GDP q/q 0.60% 0.60% GBP Halifax HPI m/m 0.90% EUR Spanish Services PMI 49.3 48.5 EUR Italian Services PMI 49.2 48.7 EUR Final Services PMI 51 51 GBP Services PMI 59.8 60.2 EUR Retail Sales m/m 0.50% -0.50% EUR Revised GDP q/q 0.30% 0.30% USD Challenger Job Cuts y/y 2.30% CAD Trade Balance -0.4B -0.5B USD Trade Balance -38.6B -34.2B CAD BOC Rate Statement CAD Overnight Rate 1.00% 1.00% USD Total Vehicle Sales 15.8B 15.7M USD Beige Book ThuSep 5 AUD Trade Balance 0.11B 0.60B JPY Monetary Policy Statement JPY BOJ Press Conference EUR French 10-y Bond Auction 2.32|1.7 EUR Spanish 10-y Bond Auction 4.72|2.3 EUR German Factory Orders m/m -0.70% 3.60% GBP Asset Purchase Facility 375B 375B GBP Official Bank Rate 0.50% 0.50% GBP MPC Rate Statement EUR Minimum Bid Rate 0.50% 0.50% USD ADP Non-Farm Employment Change 181K 200K EUR ECB Press Conference USD Unemployment Claims 330K 331K USD Revised Nonfarm Productivity q/q 1.50% 0.90% USD Revised Unit Labor Costs q/q 1.00% 1.40% USD ISM Non-Manufacturing PMI 55.2 56 USD Factory Orders m/m -3.20% 1.50% USD Natural Gas Storage 67B USD Crude Oil Inventories 3.0M ALL G20 Meetings FriSep 6 AUD AIG Construction Index 44.1 JPY BOJ Monthly Report JPY Leading Indicators 107.90% 107.20% EUR German Trade Balance 15.9B 15.7B EUR French Gov Budget Balance -59.3B EUR French Trade Balance -4.5B -4.4B CHF Foreign Currency Reserves 434.9B CHF CPI m/m 0.00% -0.40% GBP Manufacturing Production m/m 0.40% 1.90% GBP Consumer Inflation Expectations 3.60% GBP Trade Balance -8.2B -8.1B GBP Industrial Production m/m 0.20% 1.10% EUR German Industrial Production m/m -0.30% 2.40% USD FOMC Member Evans Speaks CAD Employment Change 30.2K -39.4K CAD Unemployment Rate 7.20% 7.20% CAD Labor Productivity q/q 0.30% 0.20% USD Non-Farm Employment Change 181K 162K USD Unemployment Rate 7.40% 7.40% USD Average Hourly Earnings m/m 0.20% -0.10% CAD Ivey PMI 55.1 48.4 GBP NIESR GDP Estimate 0.70% ALL G20 Meetings USD FOMC Member George Speaks SatSep 7 AUD Parliamentary Elections As you can see in the calendar, there will be a lot of events happening next week, from economic releases to monetary policy meetings and press conference. By far the most awaited will be the ECB monetary policy statement and afterwards the press conference, on Thursday, and Friday the data from the US labor market.
Technical Overview On The Forex Majors (2 – 6 September) May 30, 2022 investazor Leave a Comment on Technical Overview On The Forex Majors (2 – 6 September) It has been a while since we haven’t post something on the major currency pairs, so for today we have prepared a technical analysis on the most frequent traded FX instruments. Let us start with NZD/USD, which has moved sideways from 24th of June. Now the price has reached the lower boundary but it started drawing a positive divergence. The price action made lower lows, while the 14 RSI has drawn higher lows, signaling this way a possible reversal. Now it would be better to wait for a confirmation. If the price will fall under the local support, 0.7790, the divergence could have given us a false signal and the down move could continue to 0.7677. On the other hand, a breakout above 0.7872 could trigger a rally that might get the price back to 0.8000. Chart: NZDUSD, H4 The Canadian dollar continued to lose ground after Canada reported a drop of 0.5% in the GDP. USD/CAD has come back around 1.0600 price level, a high touched in July. The price of this pair seems to be in a grey area between 1.04300 and the current highs. If the resistance will be broken then we expect a rally to 1.0700, while a drop under the support might bring the price back to 1.0300. Chart: USDCAD, Daily USD/JPY broke up from the Double Bottom pattern and continued to retest 97.00 for several times. In the bigger time frame we can see that the price is consolidating around 98.00 level. On a 4 hours chart we spot a short break of the today’s rally. It is important to wait for a breakout. If the price will break above 99.40, the next good resistance sits at 100.00; on the other hand a drop under 99.15 could be stopped at 98.50. Chart: USDJPY, H4 During the past two weeks AUD/USD had a down slope, but the pattern that has emerged is actually a reversal pattern. The Falling Wedge was confirmed by a breakout on the 240 minutes chart (4 hours), but the price of this pattern has not yet reached the pattern’s target. It has found a good support at 0.9000 but a close above this level would leave the road open for a rally to 0.91 where the Wedge’s target is set. If the price will fall under 0.8900 then the higher probability is to continue its fall all the way to 0.8800. Chart: AUDUSD, H4 We got to GBP/USD. The British pound has managed to stay in an up channel from the beginning of July. It also broke out of a Descending Triangle on 15th of August, but the rise was only sustained until 1.5750. The drop that followed brought the price back to a good demand area right next to 1.54. If the price will close, on a daily time frame, under the support level the pound might get all the way to 1.5000. If the pound’s buyers will drive the price above 1.5600 then the target will become the area between 1.5750 and 1.5800. Chart: GBPUSD, Daily Even though there are some interesting and important technical signals, do not forget to take a look over the fundamentals, and especially over the economic releases and the monetary policy.
EURUSD Forecast Before The ECB Press Conference May 30, 2022 investazor Leave a Comment on EURUSD Forecast Before The ECB Press Conference Do you remember our last EURUSD Daily Technical Perspective? The price dropped just as we expected under 1.3180 and reached a low at 1.3140. Today the Euro found some buyers who managed to bring its price back to 1.3200. It will be a little more difficult to pass by this level. It is an ex support and also a round number where sellers might have waited. Chart: EURUSD, H4 During the next trading hours, until the ECB monetary policy will be published and the press conference will start, the EURUSD might enter in a sideways move. Usually during the ECB’s press conference the volatility of this currency pairs is spiking, but before the liquidity drops pretty good. Mario Draghi is expected to be more optimistic regarding the Euro Area economy after the latest economic releases, especially from Germany. This event should not be taken alone, because the conflict in Syria is not yet over and the risk aversion could appear suddenly. Tomorrow there will also be released the unemployment claims (expected to be around 332K) and the ISM Non-Manufacturing (expected to fall to 55.2). On Friday the attention will be set on the Non-Farm Employment Change and the Unemployment Rate for the United States. Continuing with the technical analysis, we are expecting for this up move to continue all the way to 1.3300. If the price will break through this level then nothing else can stop it until 1.3400. If it will be rejected from 1.3300 then the down trend might still be in place and the price could fall to 1.3100.